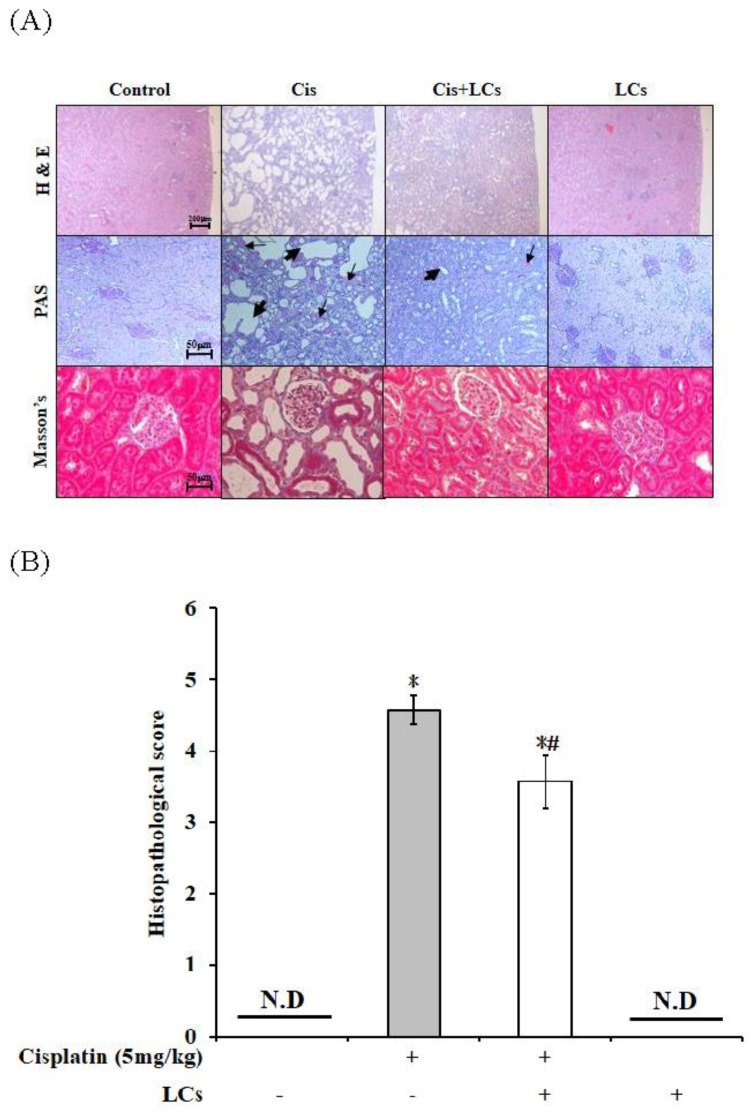
Figure 1.
Histology of the kidney sections in a cisplatin-induced nephrotoxicity model. (A) H&E staining, periodic acid Schiff staining (PAS), and Masson’s trichrome staining (MT). (B) Quantitative analysis of histopathological kidney lesions. Results are shown as mean ± SEM (n = 7 per group). * p < 0.05 compared with the control group; # p < 0.05 compared with the cisplatin group.

