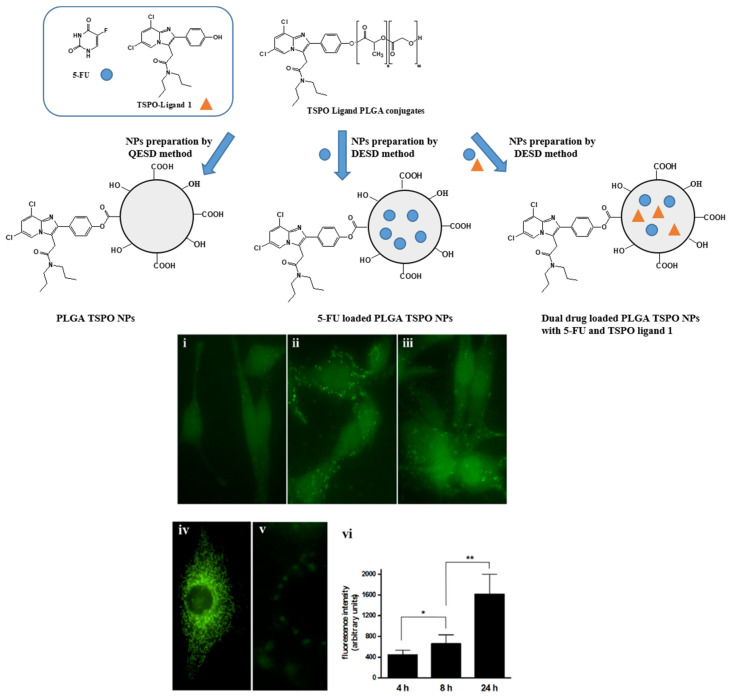
Figure 6.
Upper panel shows a schematic representation of PLGA-TSPO NPs; bottom panel shows the fluorescence microscopy images: cells were seeded onto 24 mm coverslips and treated at 37 °C in a 5% CO2 atmosphere with 0.2 μM FITC−TSPO NPs (concentration is referred to FITC). Internalized FITC fluorescence was acquired after 4 (i), 8 (ii), and 24 h (iii). Cells incubated with 25 nM MitoTracker Red CMXRos (iv) and cells treatment with FITC (7 μM) alone after 24 h (v) were used as the control. Average intensity of internalized fluorescence of treated cells as imaged after 4, 8, and 24 h of incubation (vi). Data are given as means ± SD (bars) for five separate cultures. The statistical significance of differences was calculated by the unpaired Student’s t test with Bonferroni’s correction. * p < 0.05, ** p < 0.005. Adapted with permission [34]. Copyright © 2021 American Chemical Society.

