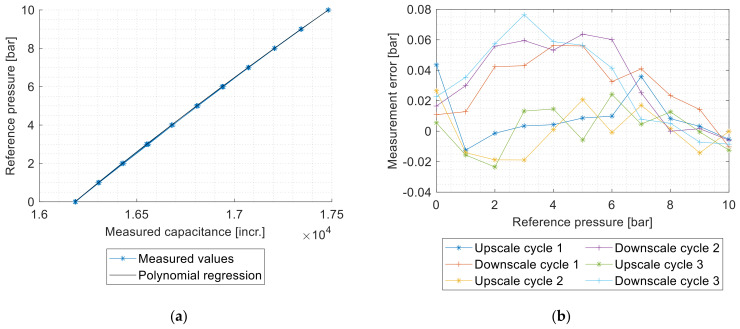
Figure 10.
Measurement result. (a) Characteristic curve with polynomial regression: the measured values were fitted with a second-order polynomial approximation to calibrate the values and to obtain the measured pressure values. (b) Error curve: the measured values for upscale and downscale cycles are shown separately, so that a possible hysteresis can be identified.

