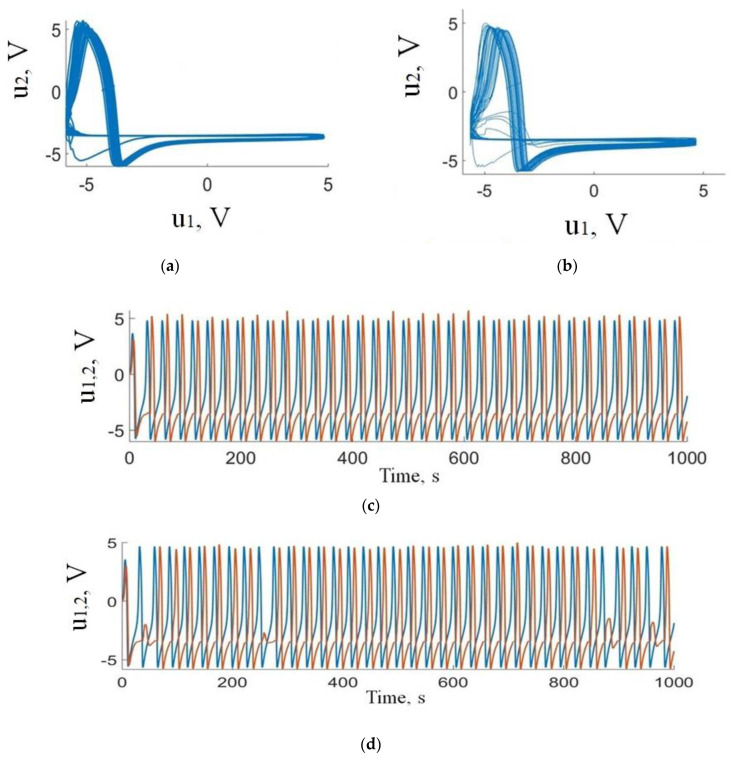
Figure 3.
Results of numerical simulations of the dynamics of FHN neuron generators with memristive coupling: (a,b) phase portraits and (c,d) time series representing (a,c) 1:1 and (b,d) intermittent frequency-locking regimes. Blue and red curves show action potentials of presynaptic (u1) and postsynaptic (u2) neurons, respectively.

