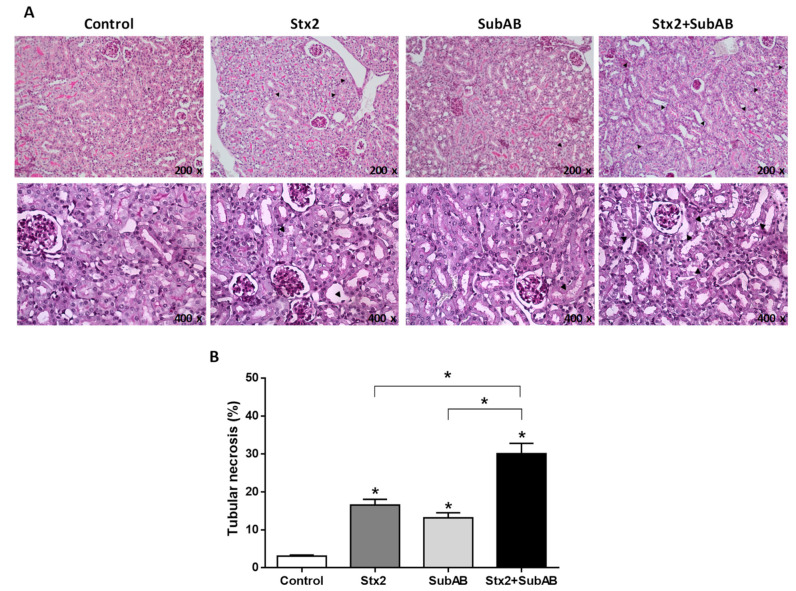
Figure 5.
Kidney histological examination of co-treated mice. (A) Optical microscopy of kidneys paraffin sections obtained after 24 h post injection with Stx2, SubAB, Stx2 + SubAB or PBS (Control) and stained with PAS (200x and 400x). Tubular necrosis (black arrow). (B) Quantification of tubular necrosis by semi-quantitative scoring. Ten fields/kidney were quantified (n = 3). Data are expressed as means ± SEM of tubular necrosis percentage. Stx2, SubAB, Stx2 + SubAB vs. Control, or Stx2 + SubAB vs. Stx2 SubAB * p < 0.05.

