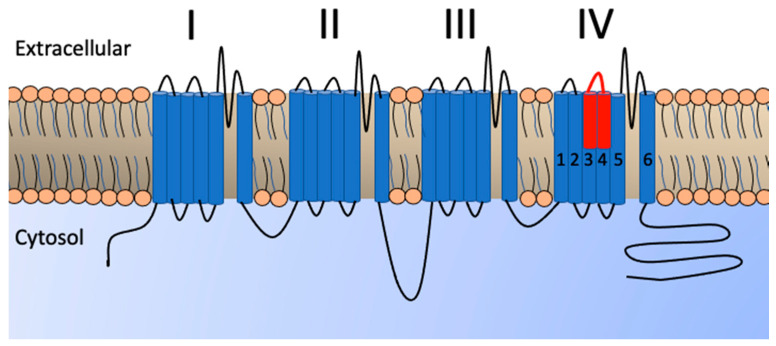
Figure 4.
Graphic depicting the basic structure of a voltage-gated ion channel α-subunit displaying the position of the voltage-sensing domains I–IV in the phospholipid bilayer. Blue cylinders represent transmembrane helices while black lines represent connective loops. Highlighted in red is the S3–S4 extracellular loop of voltage-sensing domain IV used in the biolayer interferometry assays. As previously validated [57,80], biosensor mimotopes were designed from sequences for this region, as follows: for CaV1.2 (Homo sapiens), AEHTQSSPSMNAEENSRISITFFRLFRVMRLVK, and for NaV1.4 (Homo sapiens), SIVGLALSDLIQKYFVSPTLFRVIRLARIGRVLR.

