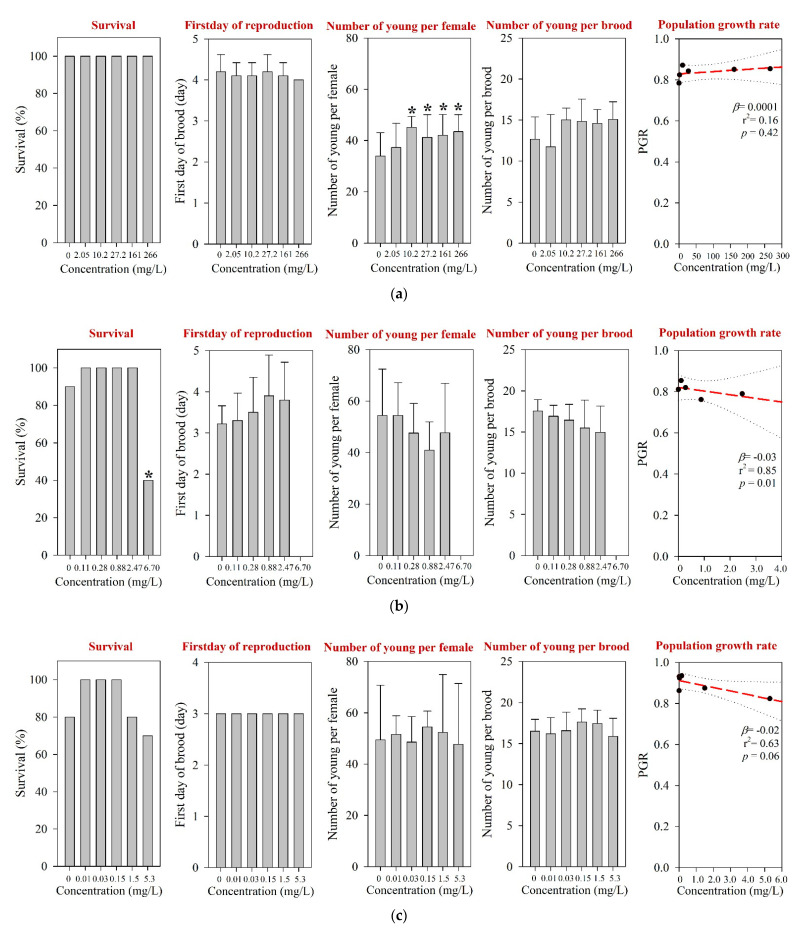
Figure 2.
Results of the 7-d chronic M. macrocopa test for (a) amoxicillin, (b) enrofloxacin, and (c) neomycin. The results are shown as mean ± standard deviation (n = 10). Asterisk (*) denotes a significant difference in the observation endpoint from that of the control (p < 0.05). Monotonous trend was assumed as the number of young per female of M. macrocopa exposed to amoxicillin (a). β, slope; r2, coefficient of determination; p, probability value.

