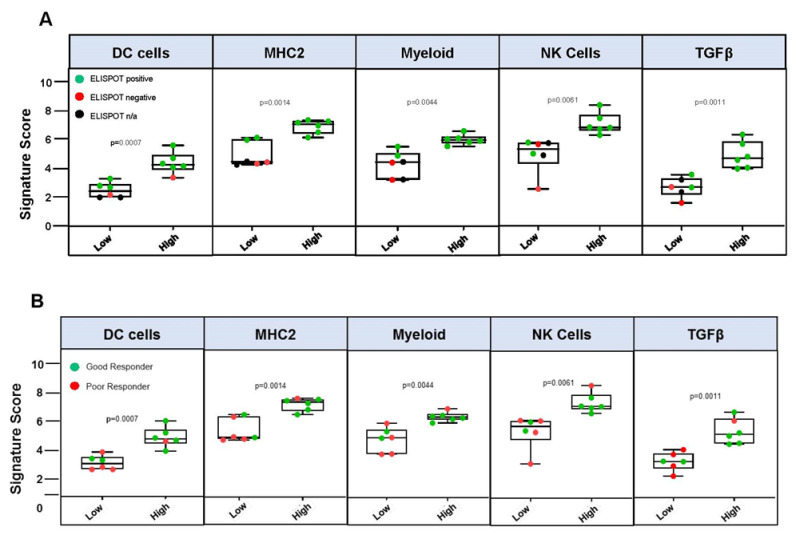
Figure 7.
Box plots displaying the distribution of signature scores within the low- and high-expression groups (cutoff = score median) and correlation with (A) ELISPOT reactivity post-Vigil treatment. ELISPOT-positive (green), -negative (red) or not tested (black) patients are displayed. (B) Signature scores within the low- and high-expression groups (cutoff = score median) and correlation with overall survival > 12 months (GR) or <12 months (PR) post-Vigil treatment. GR (green), PR (red) patients are displayed. Whiskers represent minimum and maximum TIS scores. Statistical analyses of TIS scores were performed using unpaired T-tests with Welch correction.

