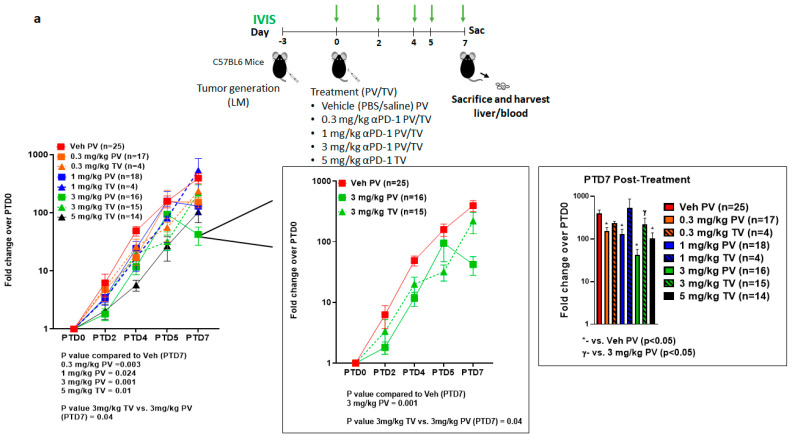
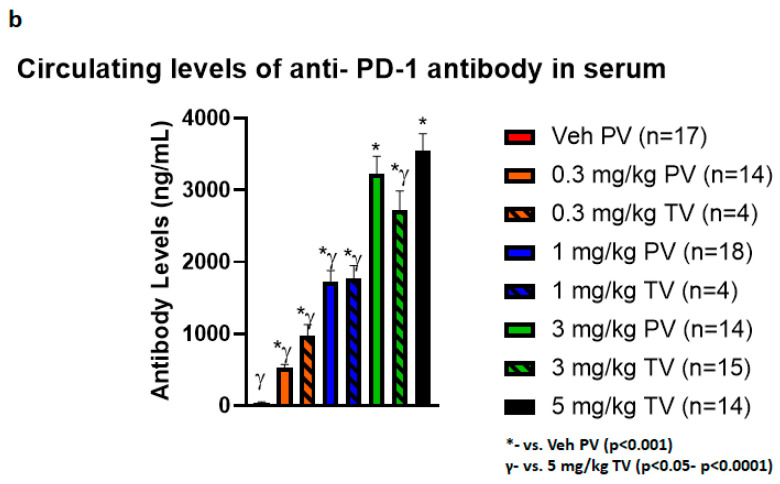
Figure 2.
Regional delivery of anti-PD-1 treatment inhibited tumor growth at 3 mg/kg dose. (a) Schematic representation of tumor development with MC38-CEA-luc and treatment timeline. Mice were separated into eight treatment groups and treated according to the schema depicted with vehicle control (Veh) via portal vein (PV) or 0.3 mg/kg, 1 mg/kg, 3 mg/kg tail vein (TV) or PV and 5 mg/kg TV. Number of mice for each group is shown in the graphs. Bioluminescence (green arrows) was measured using IVIS imaging on post-treatment day (PTD)0 (baseline), PTD2, PTD4, PTD5, and PTD7 and represented as fold over PTD0 in log scale. Right graph shows the inset of Veh PV, 3 mg/kg PV, and 3 mg/kg TV and PTD7 bioluminescence comparison of different doses and routes of administration. Results are shown as mean ± SEM. (b) Circulating levels of anti-PD-1 antibody were assessed on PTD7 to determine levels of systemic exposure in the serum via a sandwich ELISA against Rat IgG2a proteins. The 0.3 mg/kg PV dose demonstrated significantly lower circulating levels against all other doses regardless of route of delivery while the 1.0 mg/kg PV dose also showed significantly reduced amounts compared to higher doses regardless of route of delivery. There was no significant difference seen between circulating levels of antibody when comparing the 3.0 mg/kg dose directly between PV and TV. Furthermore, 3.0 mg/kg TV did show statistically significant levels lower than 5.0 mg/kg TV, but this did not translate into appreciable differences in efficacy.


