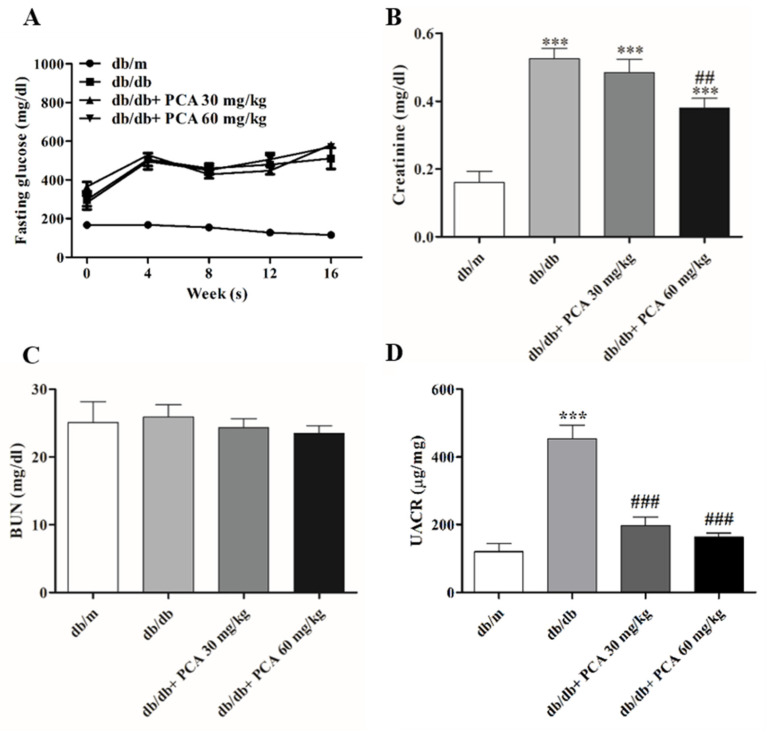
Figure 2.
Renal function evaluations of mice. (A) Blood glucose levels were detected every 4 weeks (n = 8). (B,C) Quantification of serum creatinine and BUN, respectively (n = 8). (D) Urine albumin-to-creatinine ratio. The data are presented as means ± SD. *** p < 0.001 compared to db/m mice. ## p < 0.01, ### p < 0.001 compared to db/db mice.

