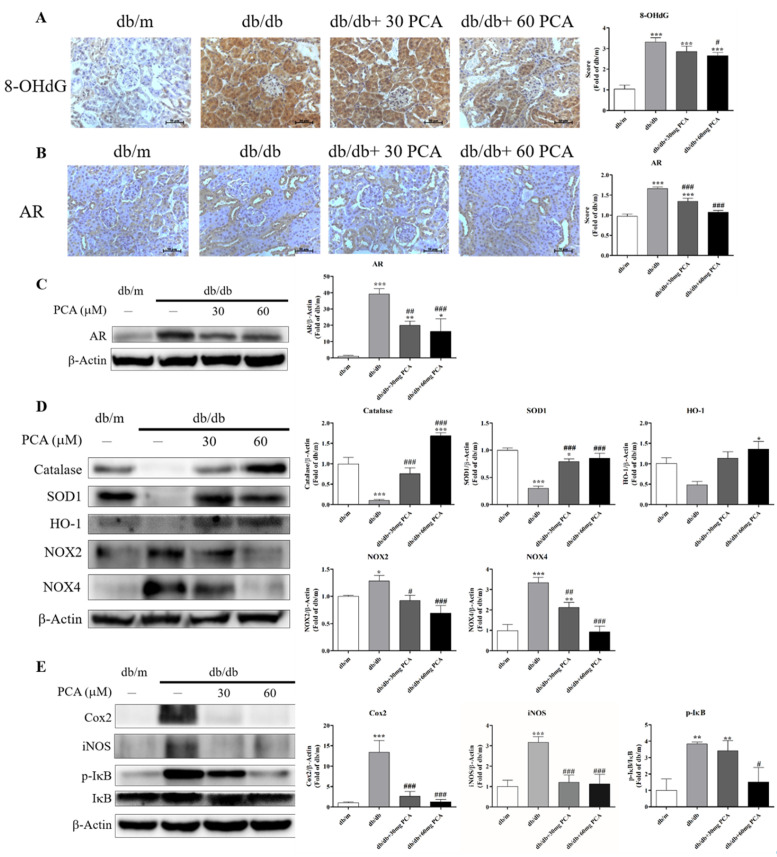
Figure 7.
Effect of PCA treatment on expression of AR, 8-OHdG, and markers of oxidative stress and inflammation in db/db mice kidneys. (A) Photographs of IHC for 8-OHdG (n = 5). Scale bar represents 50 μm. (B) Photographs of IHC for AR (n = 5). Scale bar represents 50 μm. (C) Western blot analyses were used to detect AR protein levels (n = 3). (D) Western blot analyses were used to detect oxidative stress-related marker protein levels for catalase, SOD1, HO-1, NOX2, and NOX4 (n = 3). (E) Western blot analyses were used to detect inflammation marker protein levels for Cox2, iNOS, p-IκB, and IκB (n = 3). The data are presented as means ± SD. * p < 0.05, ** p < 0.01, *** p < 0.001 compared to db/m mice. # p < 0.05, ## p < 0.01, ### p < 0.001 compared to db/db mice.

