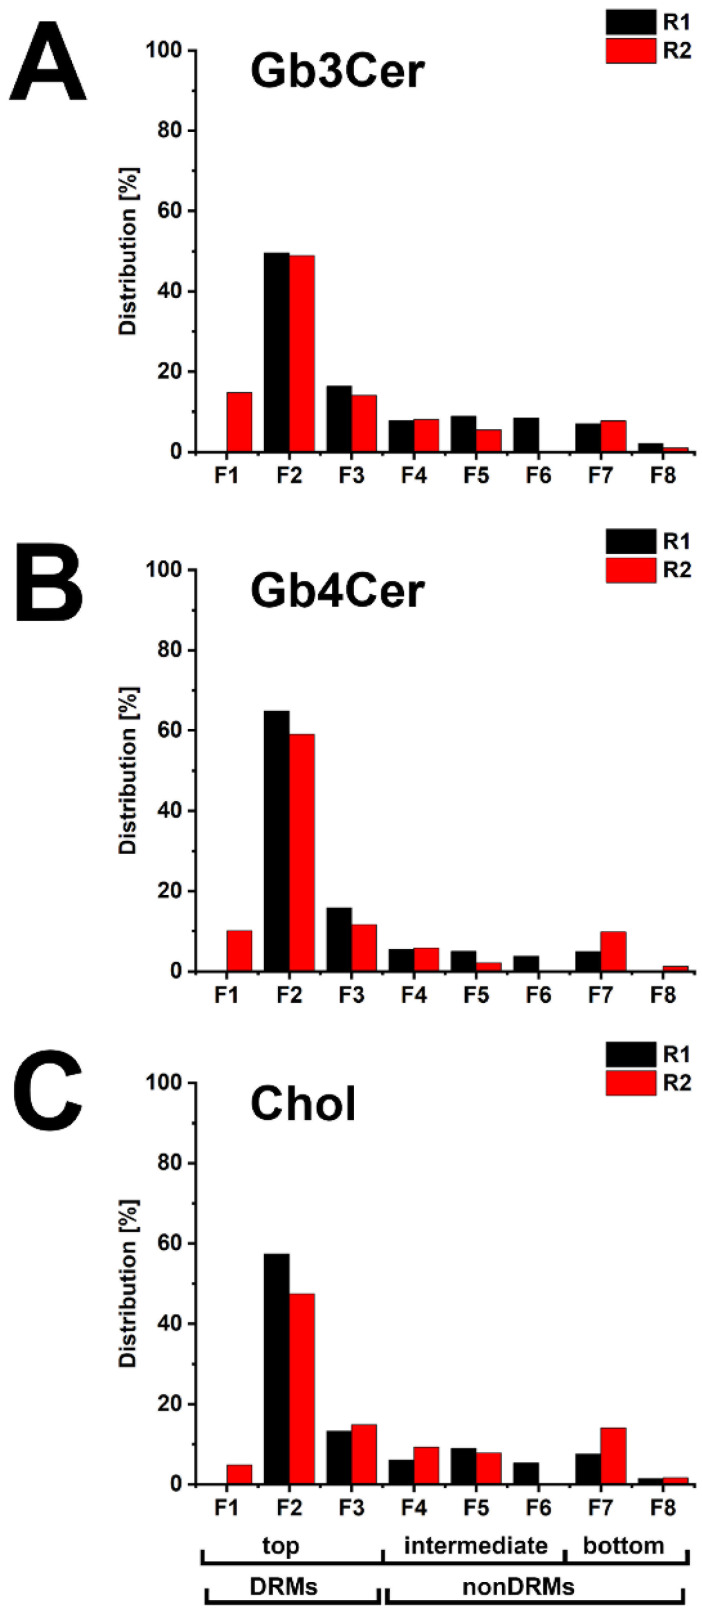
Figure 4.
Distribution of Gb3Cer (A), Gb4Cer (B), and cholesterol (C) to sucrose gradient fractions F1 to F8 of the two biological replicates R1 and R2 obtained from pHRPTEpiCs. The TLC immunopositive Gb3Cer and Gb4Cer and the cholesterol bands shown in Figure 3 were densitometrically quantified, and each fractionation was normalized to 100% as displayed in the bar diagrams for Figure 3.

