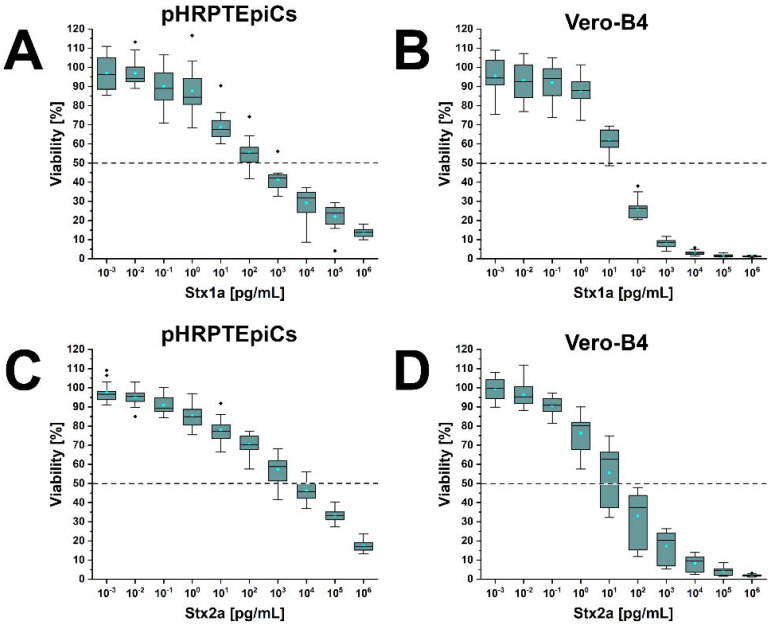
Figure 7.
Cytotoxic response of pHRPTEpiCs (A,C) and the Vero-B4 reference cell line (B,D) to exposure of increasing concentrations of Stx1a and Stx2a. Cytotoxicity was quantified by means of the crystal violet assay showing the absorption readings of Stx1a- and Stx2a-challenged cells as box plot charts. Measured values are depicted as percentages in relation to 100% viability of untreated parallel cell cultures. Approaches were performed as 6-fold measurements of three independent cell culture replicates (one replicate of passage 4 and two replicates of passage 5).

