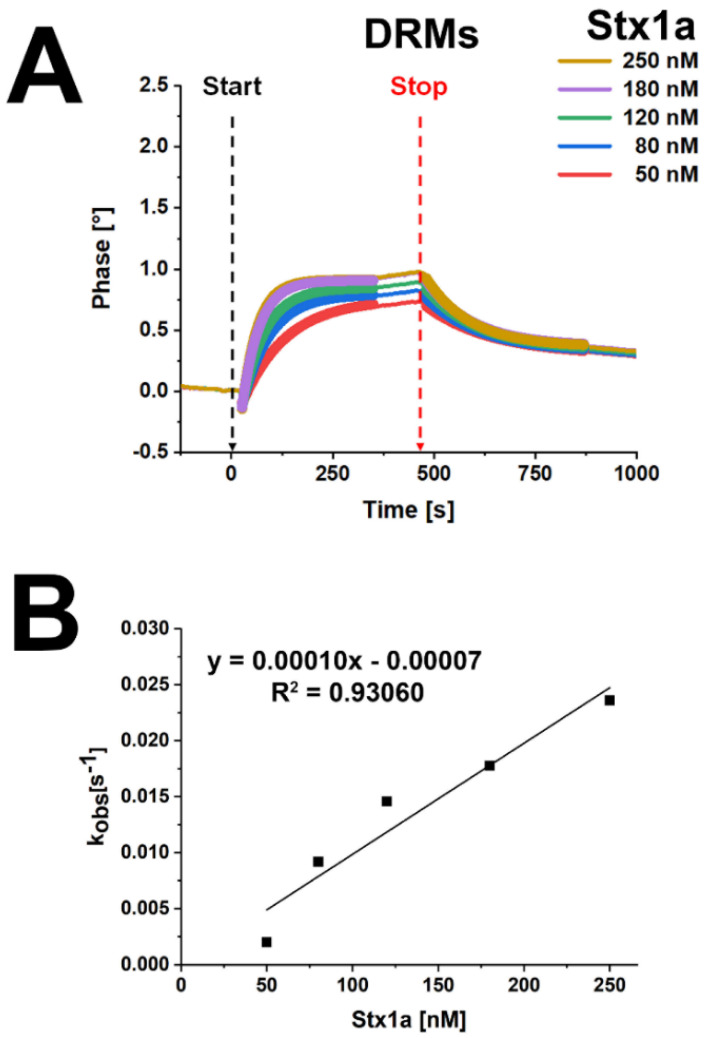
Figure 9.
SAW real-time interaction sensorgram of Stx1a with DRM fractions prepared from replicate 1 of pHRPTEpiCs (A) and function graph according to the equation kobs = kass × c + kdiss, yielding the calculated dissociation constant KD of Stx1a (B). The interactions between increasing concentrations of Stx1a and pooled DRMs (F2 and F3) (see Figure 8) are portrayed as association curves (ascending bold lines, left side of the panel) and dissociation curves (descending bold lines, right side of the panel). The calculated rounded rate constants kass and kdiss and the equilibrium dissociation constant KD of the real-time interaction analysis using five-channel measurements of DRMs are summarized in Table S1 in the Supplementary Materials. Start: begin of Stx injection; stop, end of Stx exposure.

