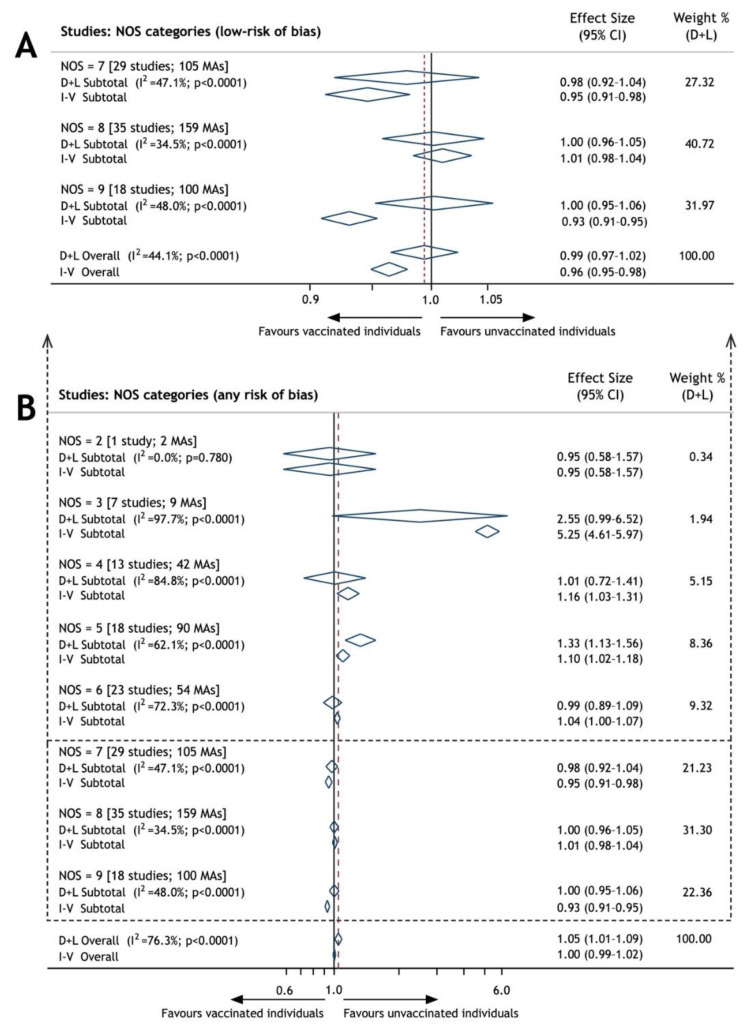
Figure 2.
Forest plot of overall and NOS-grouped effect sizes of vaccine-associated autoimmune disorders; weight derived from random effect analysis (dashed line in point of pooled ES); (A) any risk of bias risk studies; (B) low-risk of bias studies; MAs: measures of association; NOS: Newcastle–Ottawa Scale; I2: index of inconsistency; D-L: DerSimonian–Laird method, random-effects model; and I-V: inverse variance method, fixed-effects model.

