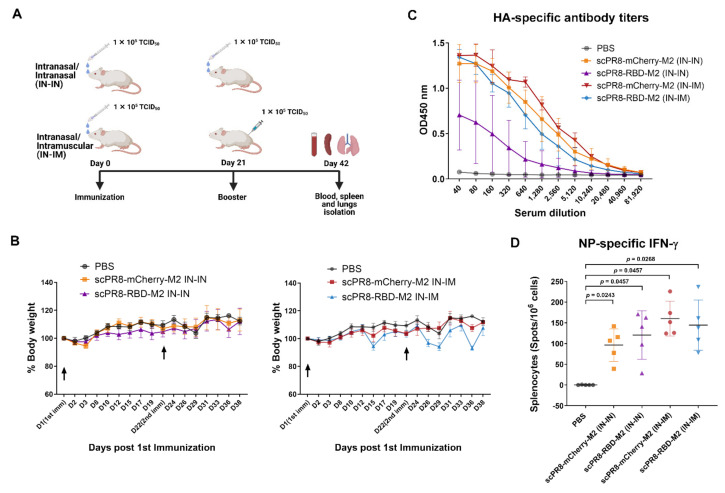
Figure 4.
Immunization schedule and immune responses to influenza virus proteins. (A) Experimental design displaying vaccination schedule, routes, and sample collection. (B) Weight of individual mice was measured for the duration of study to monitor for any signs of disease. (C) HA specific antibody response measured by ELISA. (D) Splenocytes were stimulated with the conserved H2-Kd-restricted NP peptide 147–158 [18]. Influenza A NP-specific T cells were quantified using ELISPOT assay. Error bars represent the mean ± standard error of mean. p values < 0.05 were considered statistically significant.

