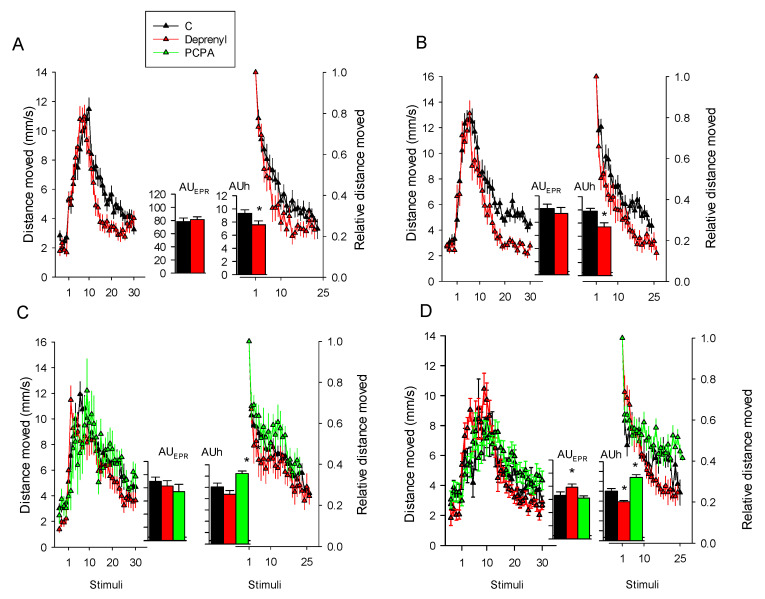
Figure 1.
Daphnia photomotor responses to repetitive light stimuli following 24 h exposures to 1 and 10 mg/L of deprenyl and PCPA, respectively. Plots of the average distance moved ± SE (n = 12–24) against 30 tapping stimuli at 5 s ISI and corresponding bar charts (graph inlet) of the calculated area under the curve (mean ± SE) for EPR (AUCEPR) and habituation AUCh phases. Within each of the four graphs, the left plots represent the full motile responses whereas the right ones show habituation responses measuring the decrease in the distance moved (proportions) relative to the maximum response to the light stimulus delivered (set to 1). Graphs (A,B) depict the data obtained across two independent experiments for deprenyl exposures, (C,D)—for deprenyl and PCPA exposures. Within the AUC bar graphs, * means significant (p < 0.05) treatment differeces relative to the controls following the Student’s t-test or ANOVA and Dunnett’s test. Axis scales for the AUC (graph inlet) are depicted in graph (A).

