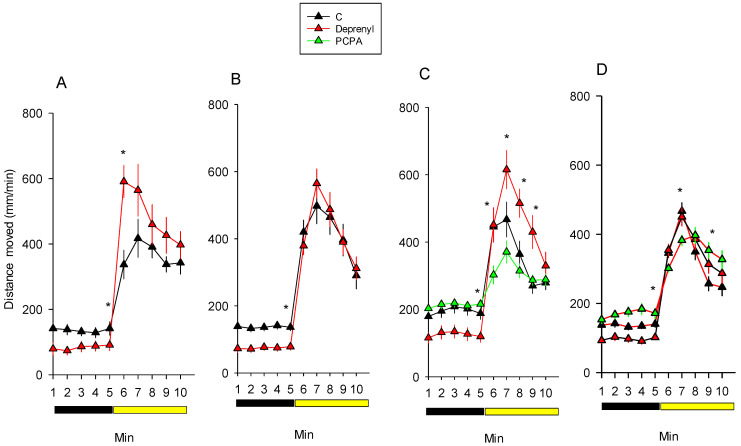
Figure 2.
Daphnia basal locomotor activity (BLM) and visual motor responses (VMR) across 5 min in darkness and 5 min with light following 24 h exposures to 1 and 10 mg/L of deprenyl and PCPA, respectively. Plots of the average distance moved ± SE (n = 12–24) per minute across the 10 min of the monitored period are shown. Graphs (A,B) depict the data obtained across two independent experiments for deprenyl exposures and (C,D) for deprenyl and PCPA ones. Note: * during the minutes 5–10, mean significant (p < 0.05) treatment differences relative to the controls following the Student’s t-test or ANOVA and Dunnett’s test.

