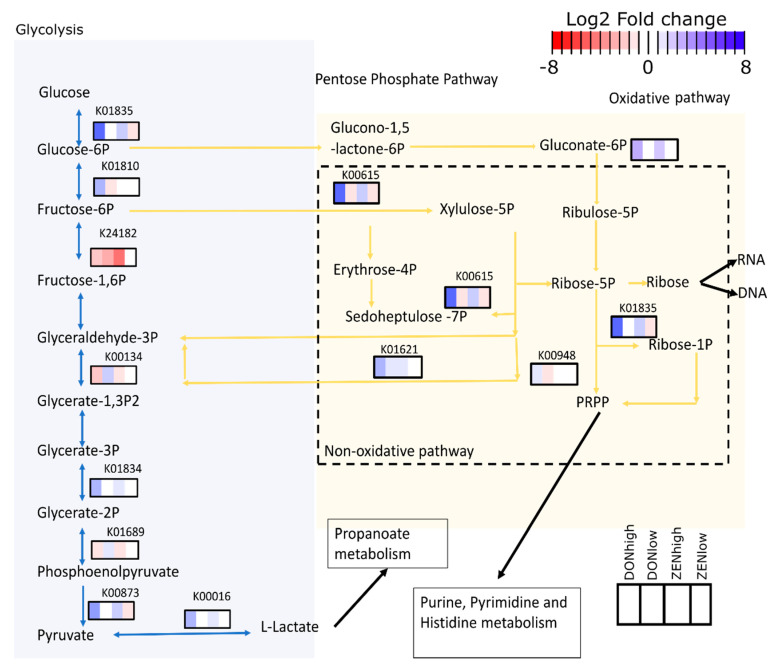
Figure 6.
Mycotoxins reduced the abundance of key enzymes of the upper glycolysis and increased proteins of the pentose phosphate pathway. Colored rectangles represent the Log2 fold change between the treatments and the control group for each identified enzyme. KEGG orthologs (KO) identifiers are shown over each square.

