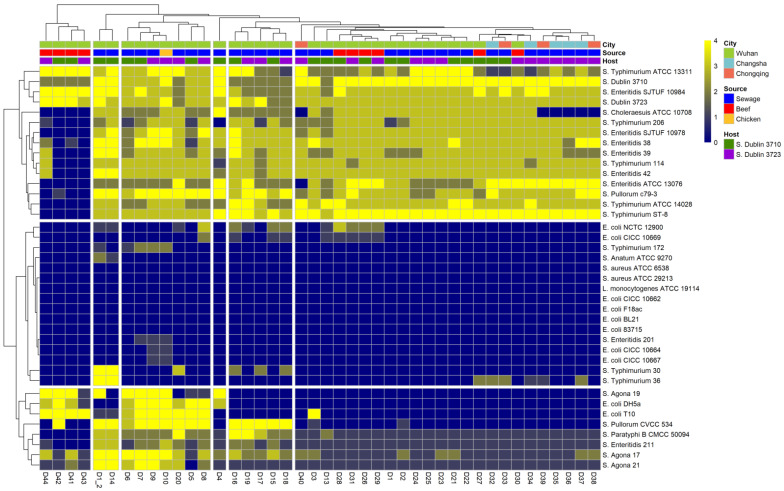
Figure 1.
Clustering analysis of the quantitative features of phage-induced plaques. The lytic activity is presented by numbers and visualized by colors from yellow to blue: “+4” denotes a completely clear zone; “+3” denotes a generally clear zone with a faint hazy background; “+2” denotes obvious turbidity throughout a clear lytic zone; “+1” denotes an individually opaque zone; “0” denotes no lytic zone. The quantitative features of the plaques were hierarchically clustered using the Euclidean distance.

