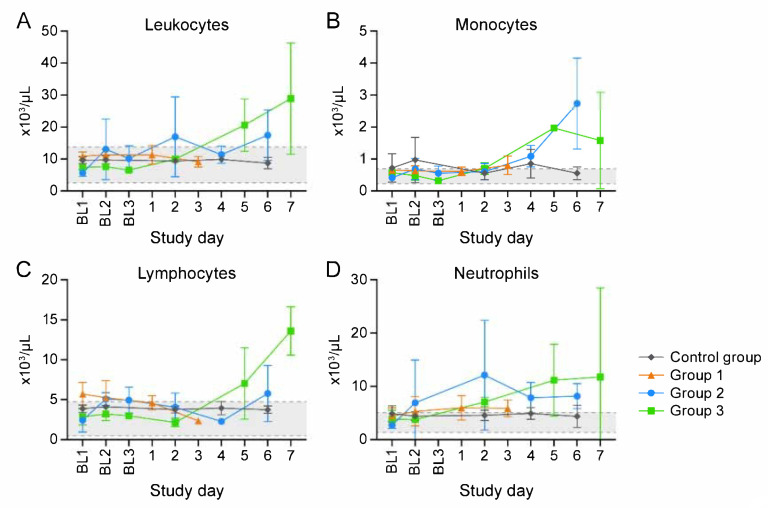
Figure 3.
Clinical pathology supports inflammatory response. Total leukocyte (A), monocyte (B), lymphocyte (C), and neutrophil (D) number changes indicate inflammation. BL = baseline sampling, time points prior to intravenous (IV) cowpox virus (CPXV) exposure. Error bars reperesent standard deviation. Day 0 is not included on the graphs because no measurements were made.

