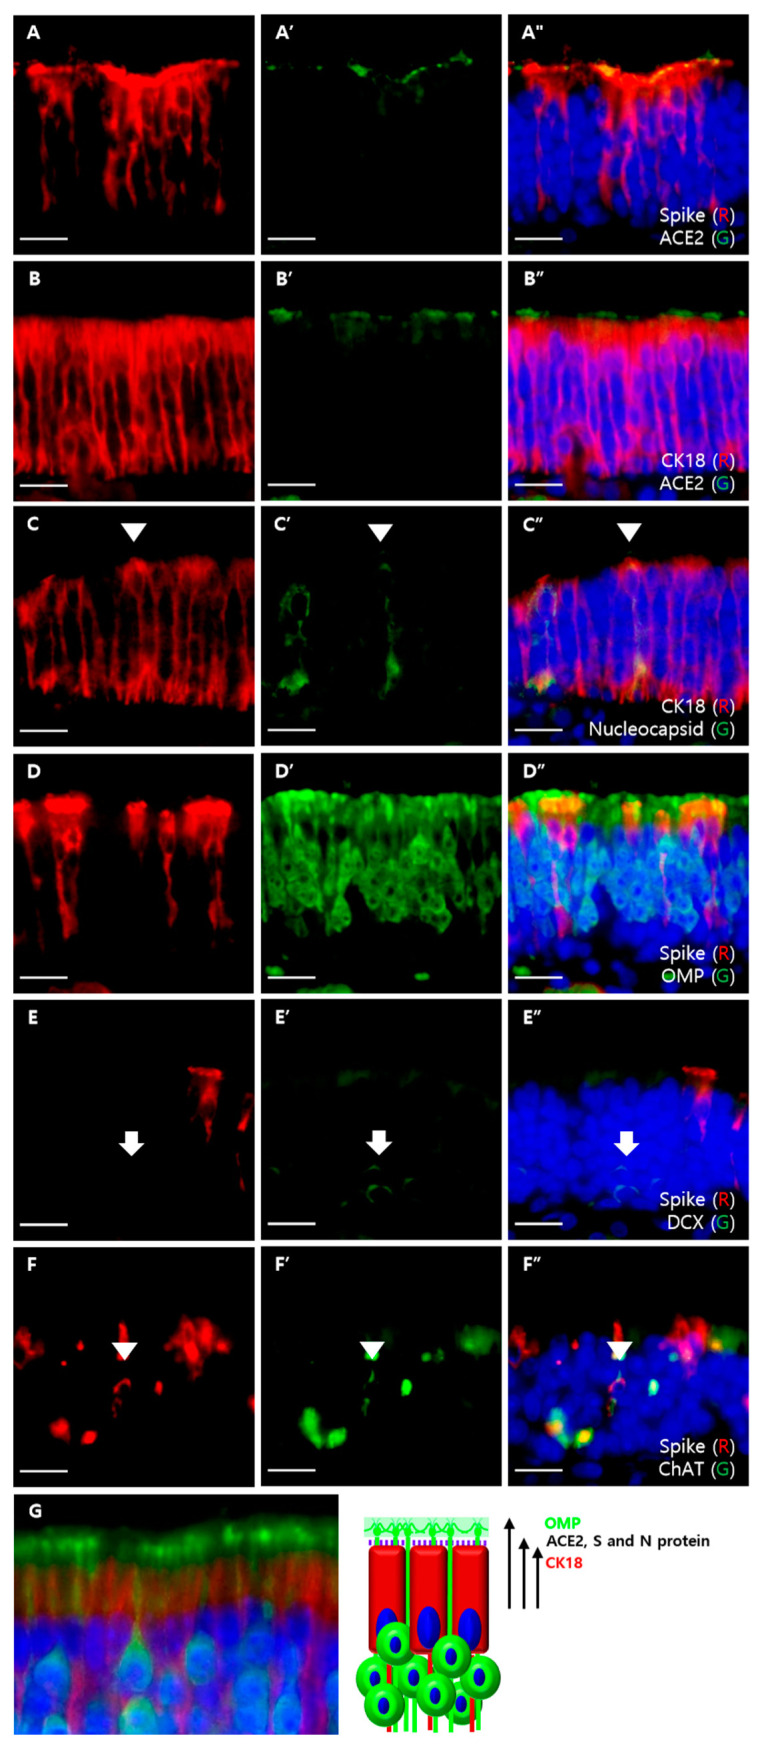
Figure 3.

Double immunofluorescent labeling of MOE. All sections were counterstained with DAPI (blue). Scale bars = 20 μm. (A) Colocalization of the S protein (red) and ACE2 (green). The apical portion of the S protein and ACE2 had similar levels; (B) colocalization of CK18 (red) and ACE2 (green). The apical portions of CK18-positive cells were located lower than the levels of ACE2 expression; (C) colocalization of CK18 (red) and N proteins (green). Some CK18-positive cells were colocalized with the N protein (arrowhead); (D) colocalization of the S protein (red) and OMP (green). There was no colocalization between the S protein and OMP. Apical portions of S protein-positive cells were lower than apical portions of OMP-positive cells; (E) colocalization of the S protein (red) and DCX (green). There was no colocalization between the S protein and DCX (arrow); (F) colocalization of the S protein (red) and ChAT (green). Some ChAT-positive cells were colocalized with the S protein (arrowhead); (G) cropped images from Figure 1A that label CK18-positive SCs (red) and OMP-positive mOSNs (green), which are shown on the left, and a schematic diagram of ACE2-expressing cells is shown on the right. Using the modified sandwich method, we conclude that ACE2 is expressed on the cell membrane of SCs, which is not labeled by CK18 and is below the densely labeled OMP-positive dendritic knob.
