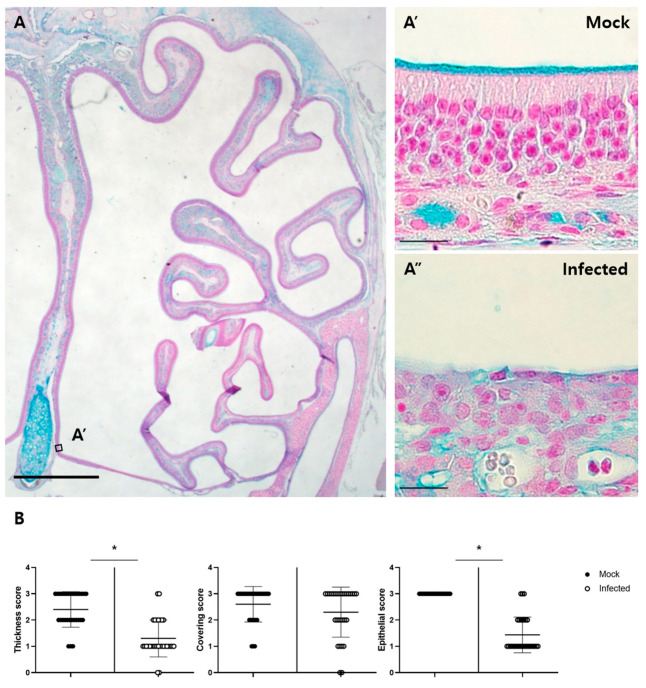
Figure 5.
Pathologic changes in the MOE. (A) AB-PAS staining in the MOE of the mock group. A’ and A” are representative images cropped from the same region of the mock and infected groups, respectively. Alcian blue-positive mucus materials are seen on the luminal surface of the MOE and Bowman’s glands. The scale bar in (A) is 1 mm, and the scale bars in the cropped images are 20 µm; (B) histopathological scoring of thickness, mucus covering, and epithelial damage. The scores for mucus thickness and epithelial damage were significantly different between the mock and infected groups (* p < 0.05, Mann–Whitney U test, n = 4).

