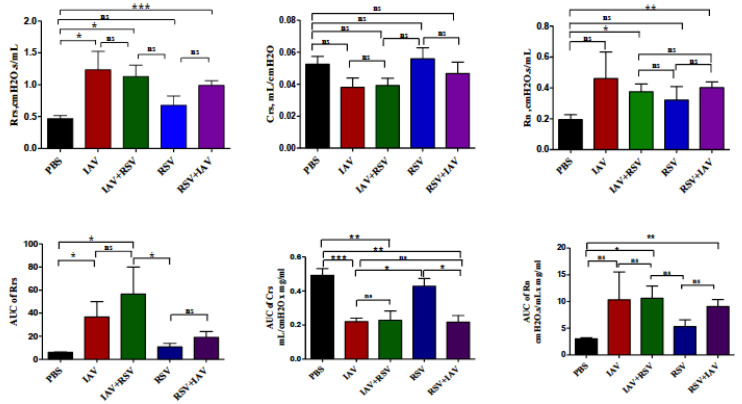
Figure 6.
Lung function assessment on day 3 post-infection. Upper panels: Baseline airway reactivity expressed as thoracic resistance (Rrs), thoracic compliance (Crs) and large airway resistance (Rn). Lower panels: Methacholine responsiveness shown as “area under the curve” (AUC) of Rrs, Crs and Rn against methacholine concentration. The values are mean ± SEM. Two separate experiments (n = 6) were performed. Asterisks denote statistically significant differences between experimental groups and the control group (* p < 0.05, ** p < 0.005, *** p < 0.0005). Two separate experiments (n = 6) were performed; ns = not significant. Comparison among groups was performed using the nonparametric test (two independent variables: Mann–Whitney).

