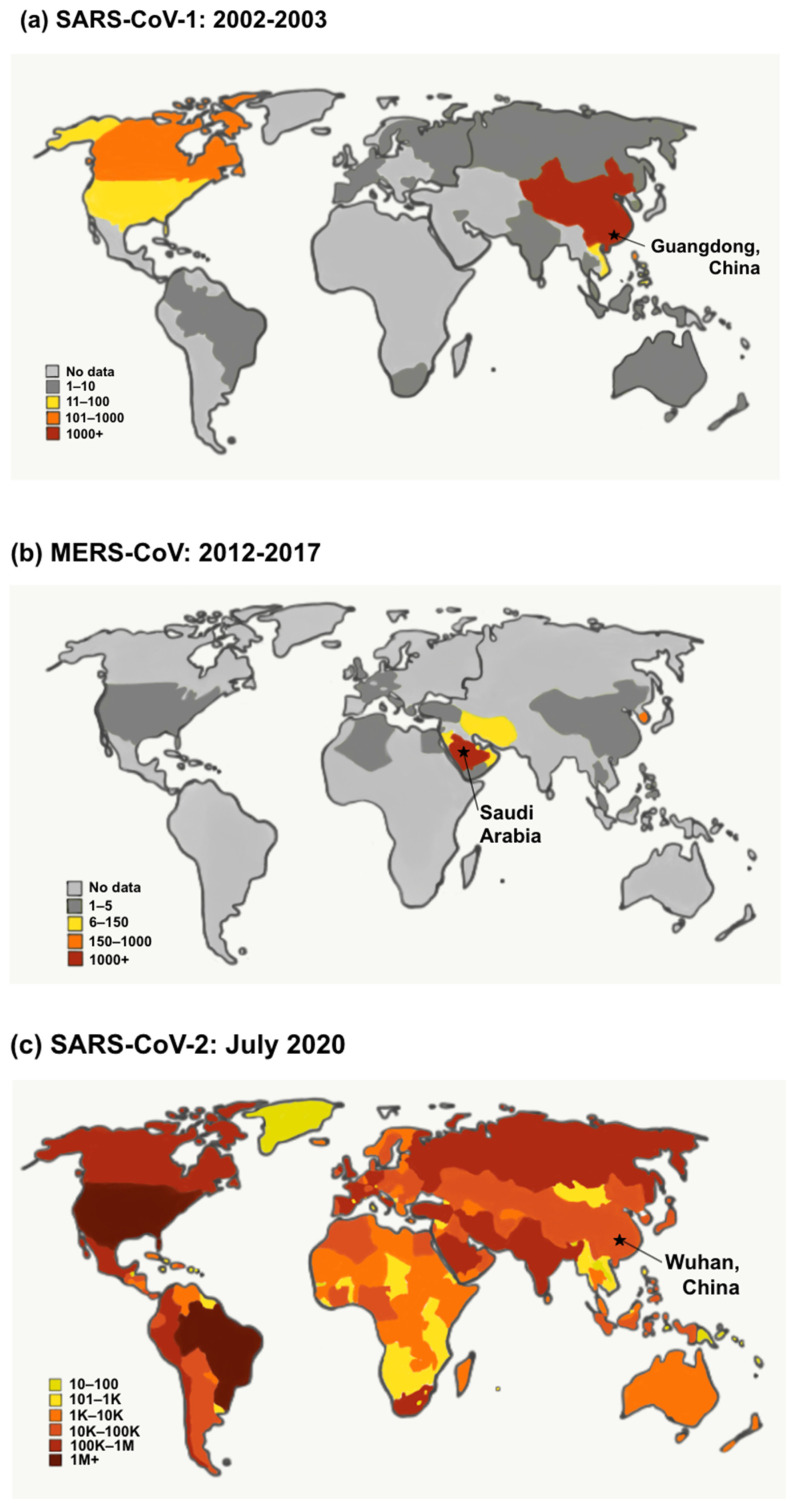
Figure 1.
The confirmed number of global cases for (a) SARS-CoV-1, (b) MERS-CoV, and (c) SARS-CoV-2. (a,b) Figures based on data from the World Health Organization. (c) Figure based on data from the John Hopkins COVID-19 report data. Note that the color scales vary for each world map. (a) The SARS-CoV-1 outbreak was reported in Guangdong, China, in 2002 from an unknown animal species, most likely a bat. The highest number of cases occurred in China (1000+), as shown in red on the map. Regions marked in orange had 101–1000 reported cases, yellow had 11–100 reported cases, and green had 1–10 reported cases. The regions in light gray have no data on reported SARS-CoV-1 cases. (b) The MERS-CoV outbreak was identified in Saudi Arabia in an animal believed to be bats but is also endemic in the dromedary camel, which is the animal reservoir responsible for human infection. The largest number of MERS-CoV cases occurred in Saudi Arabia (1000+), as shown in red on the map, and the Republic of Korea (150–1000), as shown in orange on the map. Areas with 6–150 cases are shown in yellow, 1–5 cases are shown in green, and no data on reported cases are shown in light gray. (c) The SARS-CoV-2 pandemic was discovered in Wuhan, China, in 2019 from an unknown animal origin, most likely a bat. The SARS-CoV-2 map shows the number of cumulative confirmed global cases as of December 2020. The color scale for the SARS-CoV-2 map shows a more drastic change in the number of cases as colors change. The darkest red color shows areas at more than 1 million cumulative confirmed cases. The color scale for the map reads as follows: dark red = 1 million + cases, red = 100,000 to 1 million cases, red-orange = 10,000 to 100,000 cases, orange = 1000 to 10,000 cases, yellow = 101 to 1000 cases, green = 1 to 100 cases, light gray = no data reported.

