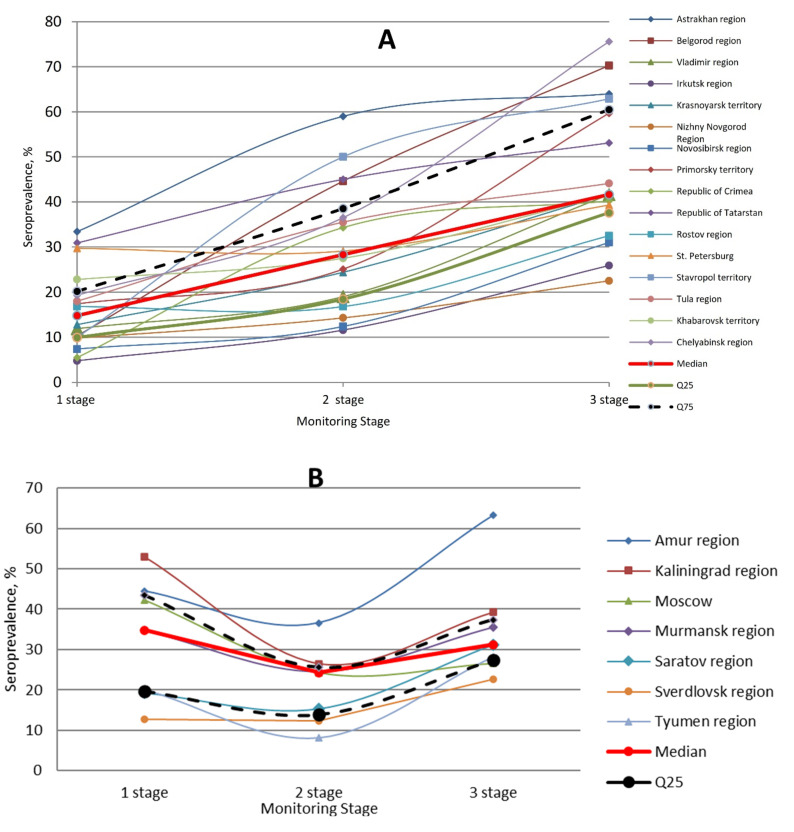
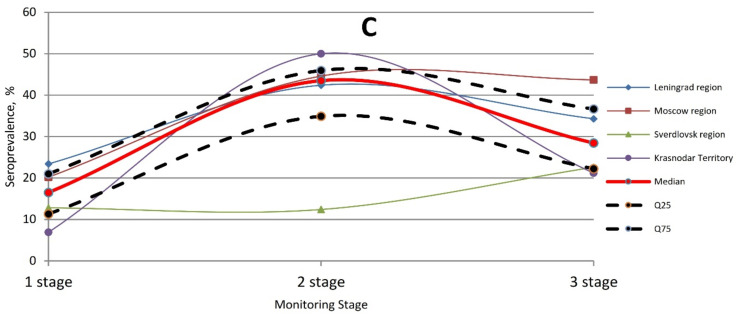
Figure 5.
Three curve types for the formation of population immunity to SARS-CoV-2 in different Russian regions. (A). The most common dynamics of formation of specific SARS-CoV-2 immunity. In the process of population contact with coronavirus, the proportion of seropositive individuals in the population increases, reaching a maximum by the 3rd phase. (B). Less frequent curve showing a slower process of seropositivity formation. By the 2nd phase, the percent of the Nc Ab seropositivity volunteers decreased. The maximum Ab level is formed only by the 3rd phase. (C). The rarest paradoxical reaction in which percent seropositive increases between phases 1 and 2, and then decreases markedly. Immunity formation dynamics in the surveyed regions are shown by thin colored lines. The median is represented by a thicker red curve. The boundaries of the interquartile range Q25—Q75 are plotted as bold, dashed lines.


