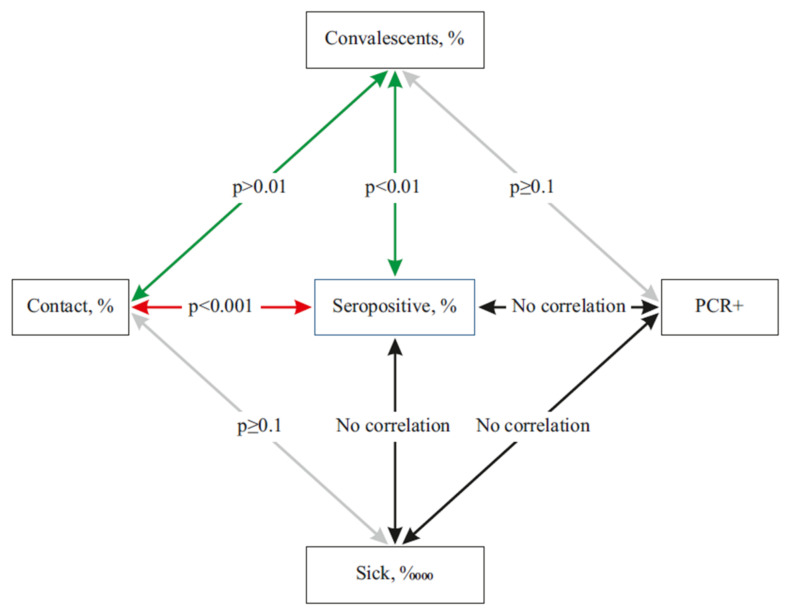
Figure 6.
Spearman correlations between COVID-19 patient states. The diagram contains five main patient conditions, which describe basic features of the interaction between the coronavirus and a susceptible host. Key: seroprevalence—the proportion of seropositive individuals in the population according to ELISA data; patients—infected with SARS-CoV-2 based on PCR results and, as a rule, having clinical manifestations of COVID-19; convalescents—patients who have recovered from COVID-19, based on PCR results; contact—persons who have had verified contact with a COVID-19 patient; PCR+—persons with a positive PCR test result without any other clinical manifestations. Colored lines mark reliable correlations between the indicators. Weak correlations are marked with gray lines; black lines indicate an absence of correlation. Reliability of relationship values (p) are shown on the arrows.

