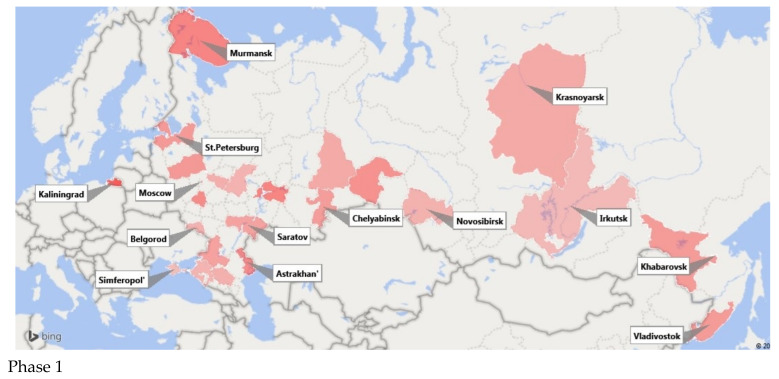
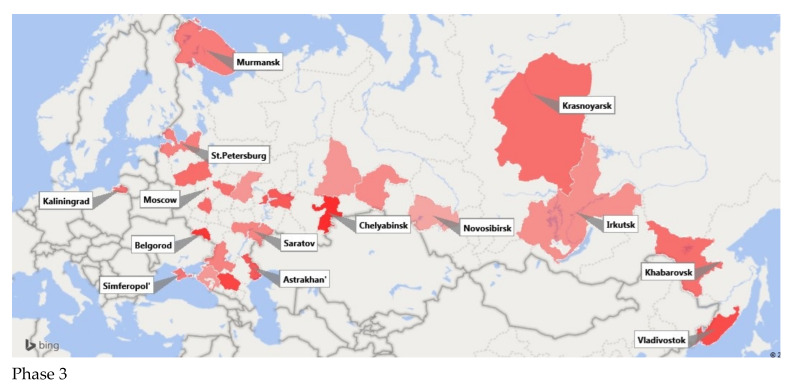
Figure 10.
Color intensity representation of SARS-CoV-2 seroprevalence, Russian population, 2020. Phase 1—Seroprevalence levels in the first phase of monitoring (June–August). Phase 3—levels in the third phase (December). Color intensity reflects the percent seropositive: the more intense the color, the higher the level of population immunity.


