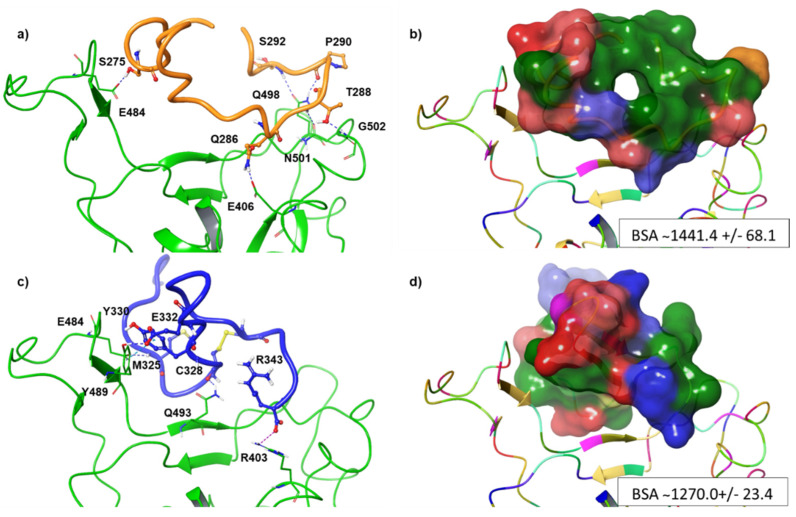
Figure 3.
Key contacting elements inside (a,b) the RBD-up/DPP4270–295 conformation, and (c,d) the RBD-up/DPP4318–343. Panels (a) and (c) show in stick representation all side chains involved in H-bonds (dark blue), π–π interactions (cyan), and salt bridges (purple). Panels (b) and (d) show the BSA area of RBD-up/DPP4270–295 complex and RBD-up/DPP4318–343, respectively. The surface area of the peptides is shown in solid style and coloured according to the atom type.

