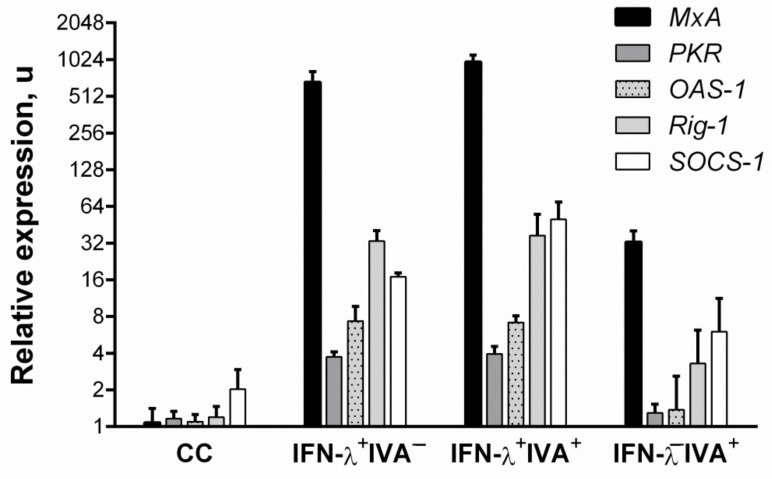
Figure 2.
Interferon-stimulated gene mRNA patterns, in response to IFN-λ1 and IVA stimulation, 24 h after treatment. A549 cells were used. CC—cell control; IFN-λ+IVA–—uninfected cells stimulated with IFN-λ1 at 500 ng/mL; IFN-λ+IVA+—cells infected with A/California/07/09 (H1N1pdm09) at 1 MOI and then stimulated with IFN-λ1 at 500 ng/mL; IFN-λ−IVA+—cells infected with A/California/07/09 (H1N1pdm09) at 1 MOI. Values are marked as mean ± SD.

