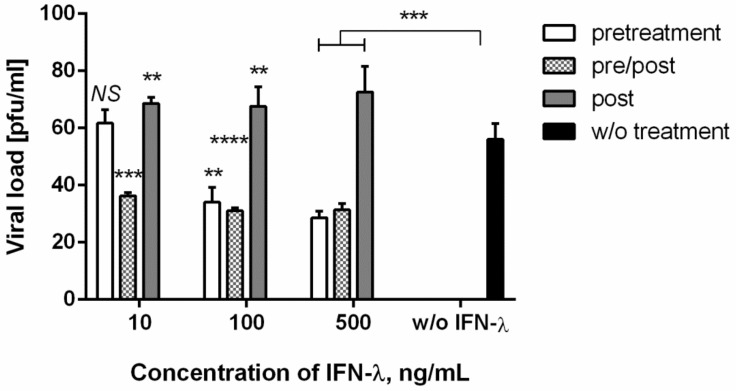
Figure 4.
Inhibition of CHIKV replication in different IFN-λ1 treatment regimes. Vero cells were used. Virus was harvested at 24 hpi, and titers were determined by plaque assay. p value significance levels were determined for cells treated with each IFN-λ1 concentration, compared to untreated cells, by two-way ANOVA, followed by the pairwise Dunnett’s multiple comparisons test: ****―Adjusted p value < 0.0001; ***―<0.001; **―<0.01; NS—no significant differences. Data are represented as mean ± SD.

