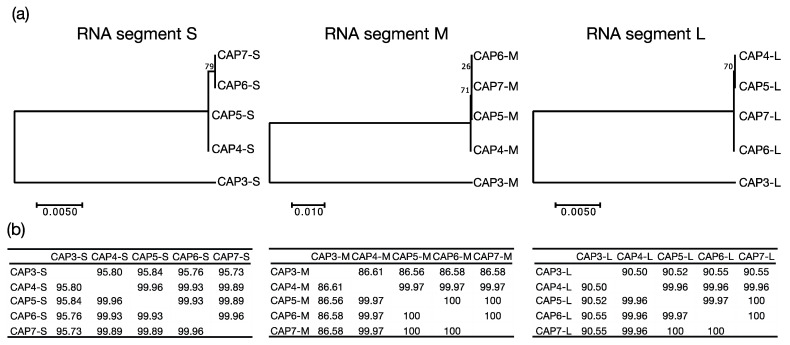
Figure 4.
Genomic sequence comparison of CAP3–CAP7 phages. (a) Molecular phylogenetic analysis was determined by the Maximum Likelihood method. Each segment (S, M, L) was compared independently, and the trees with the highest likelihood are shown. Trees are drawn to scale, with branch lengths measured in the number of substitutions per site, and bootstrap values are indicated at the appropriate branch points. (b) Percent similarity matrices compare each RNA segment (S, M, L) to the other CAP phage RNA segments.

