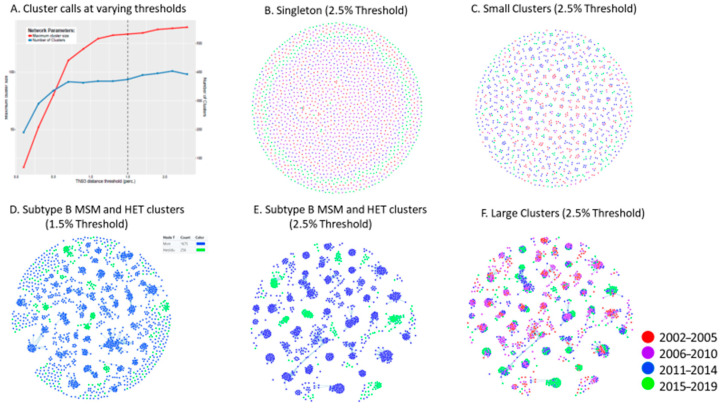
Figure 5.
Phylogenetic resolution of patterns of HIV spread using HIV-TRACE and Microbe TRACE compared to MEGA10 phylogeny. (A) The number and size of individual clusters assigned by HIV-TRACE at different genetic distances (GDs). (B) MicrobeTrace topology (2.5% GD) of singleton transmissions assigned based on MEGA10 phylogeny. 5 (C) MicrobeTrace topology (2.5% GD) of small clusters assigned using MEGA10. (D,E) MicrobeTrace (1.5% and 2.5% GD) shows singleton/small cluster outliers at 1.5% failing to associate with MEGA10-defined large clusters. (F) MicrobeTrace (2.5% GD) depicts years of infection of large cluster members.

