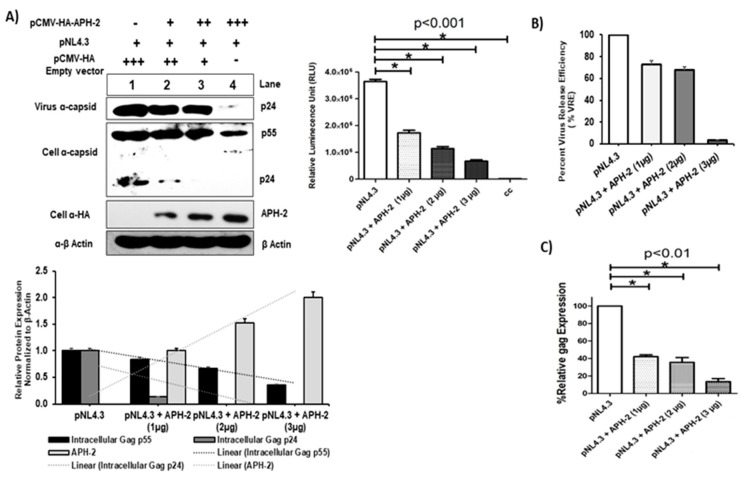
Figure 1.
APH-2 overexpression reduces HIV-1 Gag production and viral release. (A) Effect of APH-2 on full-length HIV-1 pNl4.3: 293T cells were transfected with 1 µg pNL43 HIV-1 full-length clone only, as well as with pNL4.3 and increasing amounts (1–3 µg) of plasmid-encoding HA-APH-2. Western blot was performed to examine cell-free virus production (capsid protein, p24) (Panel 1), cellular Gag precursors (Panel 2) and APH-2 expression (Panel 3). Cellular beta actin expression represents the loading control (panel 4). (Amount of plasmid used is represented in figure as, − = 0 μg; + = μg; ++ = 2 μg; +++ = 3 μg). Graph below shows densitometric analysis of Western blot performed using Image J software, and relative cellular protein expression normalized to β-actin. Graph in the upper right part of the figure shows the infectivity of released virions in the TZM-bl single-cycle infectivity assay (n = 3 ± standard deviation). p-values were determined using a Student’s t test. * p < 0.001. (B) HIV-1 virus release efficiency: Densitometric analysis was performed using NIH Image J software and graph was plotted for average percent change in Gag expression. The efficiency of virus release was calculated as the amount of virion-associated p24, as a fraction of the total amount of Gag (virion-associated p24 plus all the cellular precursors of Gag) relative to pNL4.3, which was arbitrarily set at 100. (C) Relative gag expression in the presence of APH-2: Cell lysate on post-transfection subjected to total RNA isolation followed by real-time qPCR for measurement of relative gag mRNA expression, gag expression normalized with endogens control B-actin and percent gag expressed with and without APH-2 are shown in the graph. Cellular gag expression in 293T cells (n = 3 ± standard deviation), p-values were determined using a Student’s t test. * p < 0.01.

