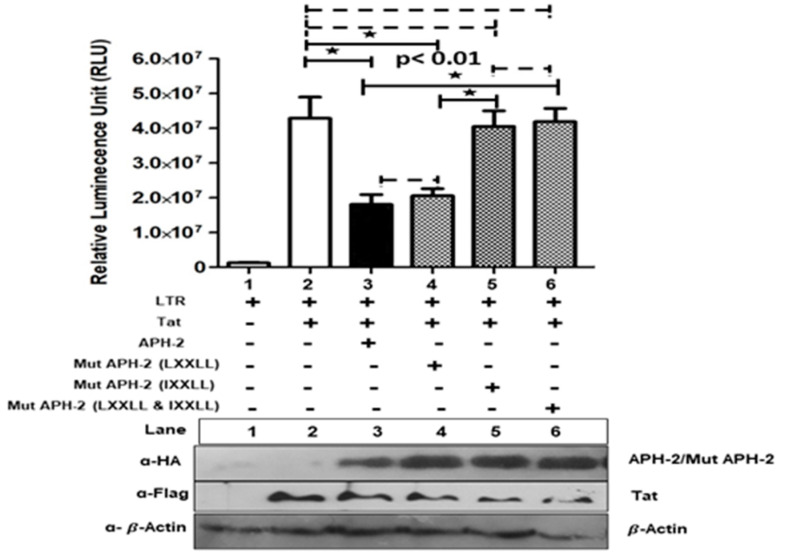
Figure 3.
Effect of APH-2 on HIV-1 Tat-mediated transcription: 293T cells were transfected with pBlue3′LTR (1 µg) only and co-transfected with pCDNA3.1 Tat 101-flag (3 µg), HA-APH-2 (3 µg), as well as mutant versions of HA-APH-2 (3 µg), (+ and − sign used to represent presence and absence of plasmid used for transfection) as shown in the figure. The graph represents the luciferase activity measured 24 h post-transfection (n = 3 ± SD). p-values were determined using a Student’s t test. * p < 0.01. Dashed lines indicate no significant difference. The bottom panel represents the cellular expression of pCDNA3.1 Tat 101-flag, HA-APH2 and HA-APH-2 mutants. Cellular beta actin expression represents the loading control.

