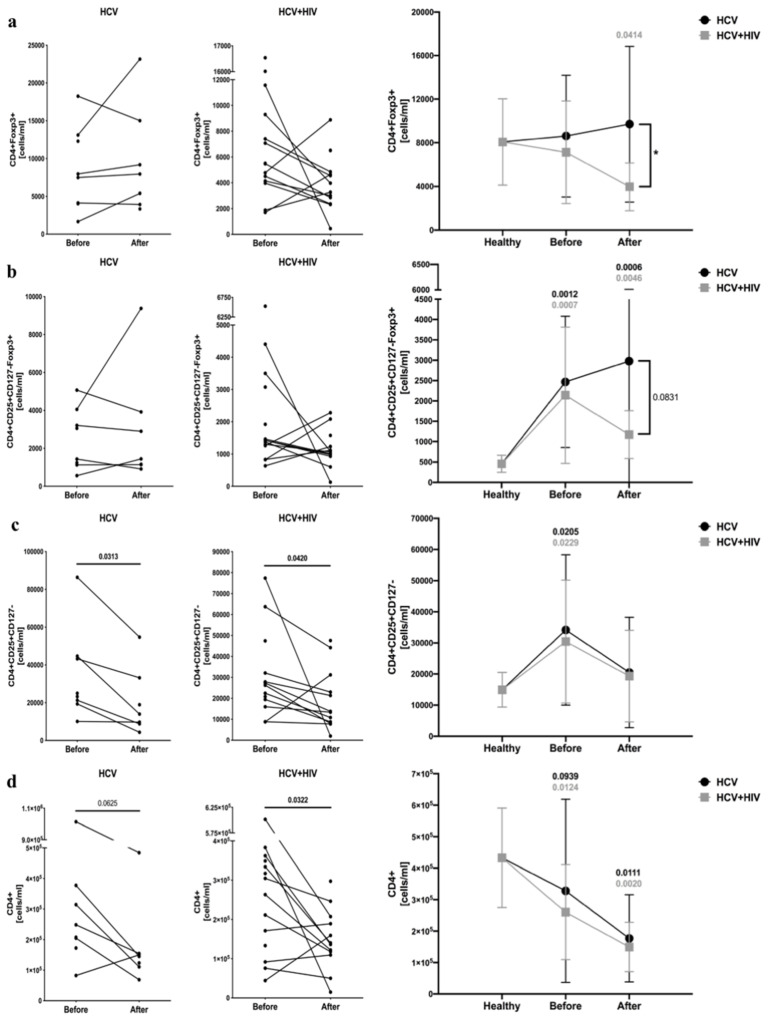
Figure 2.
Anti-viral treatment effects on regulatory T cells absolute numbers in HCV-infected (left column) and HCV/HIV-coinfected (right column) patients. Data presenting the effects of therapy and differences between studied groups in the course of treatment in relation to healthy control subjects. Treg-related parameters included: CD4+Foxp3+ (a), CD4+CD25+CD127−Foxp3+ (b), CD4+CD25+CD127− (c), and total CD4+ (d) lymphocytes.

