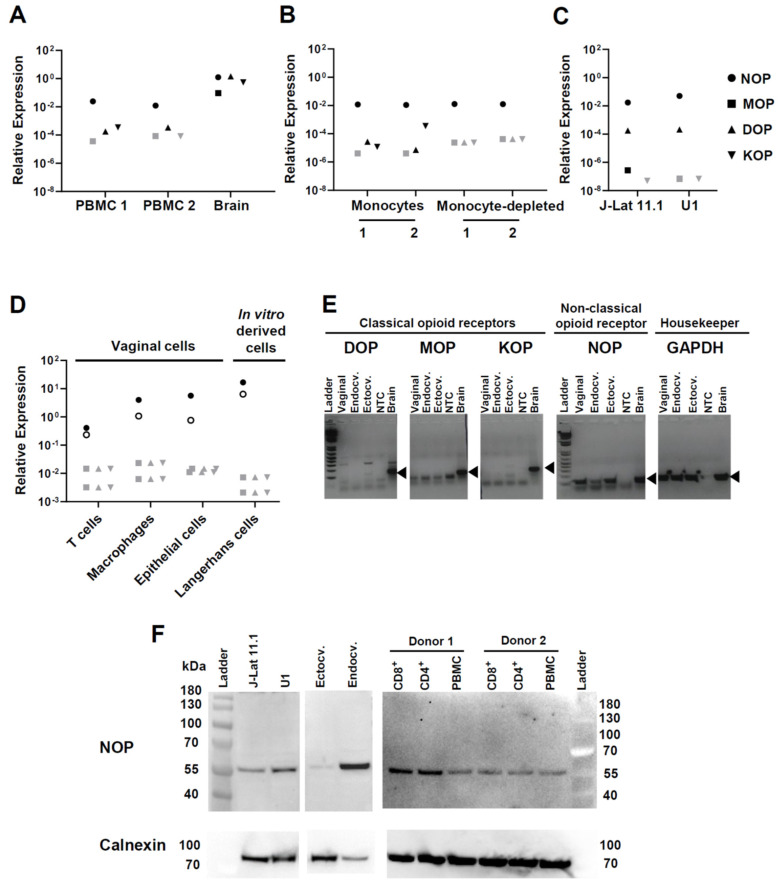
Figure 1.
Expression of opioid receptors in different primary cells. RNA isolated from the indicated cell types was assessed for expression of opioid receptors by qPCR. NOP indicates the non-classical nociceptin/orphanin FQ (N/OFQ) peptide (NOP) receptor (OPRL1); MOP indicates the mu receptor (OPRM1); DOP the delta receptor (OPRD1) and KOP the kappa receptor (OPRK1). Relative expression of each receptor was defined as 2−ΔCt. ΔCt is calculated as: ΔCt = Ct (opioid receptor) − Ct (PPIA or GAPDH). Each symbol represents the average of technical duplicates. (A) PBMC were from two healthy donors, and brain RNA was purchased. Opioid receptor expression on the y-axis is relative to the housekeeping gene PPIA. Similar results were obtained when GAPDH was used as normalizer (not shown). For a given opioid receptor qPCR analysis, samples with negative amplification (i.e., Ct > 40) are denoted with gray shaded symbols. (B) Gene expression analysis was done in the monocyte-enriched and monocyte-depleted fractions derived from PBMC of two additional healthy donors. (C) Gene expression analysis in the two cellular models of HIV-1 latency: J-Lat clone 11.1 and U1 promonocytic cells. Two independent cultures of each cell line were analyzed separately; symbols represent the average of these cultures. (D) Vaginal T cells, macrophages, and epithelial cells were sorted from healthy vaginal tissues from two donors, and Langerhans cells were differentiated in vitro from hematopoietic precursors, as explained in Materials and Methods. Data represent gene expression levels per receptor and per donor (each donor is represented with either an open or close circle). Samples with negative amplification (i.e., Ct > 40) are denoted with gray shaded symbols. (E) Gel electrophoresis analysis of qPCR products generated from genital epithelial cell lines. Real-time PCR amplicons were resolved on a 2% agarose gel. Ladder: 100 bp molecular weight marker; Endocv.: endocervical; Ectocv.: ectocervical; NTC: non-template (water) control. Specific PCR amplicon for each gene is indicated with a black triangle. PPIA was used as housekeeping gene in A and D, GAPDH in B, C and E. (F) NOP expression was confirmed by western-blotting. Protein extracts were obtained from the two HIV-1 latency models (J-Lat 11.1 and U1 cell lines), from endocervical and ectocervical cell lines, from primary unfractionated PBMC, and from magnetically-purified CD4+ and CD8+ T cells isolated from two donors. Calnexin is shown as loading control.

