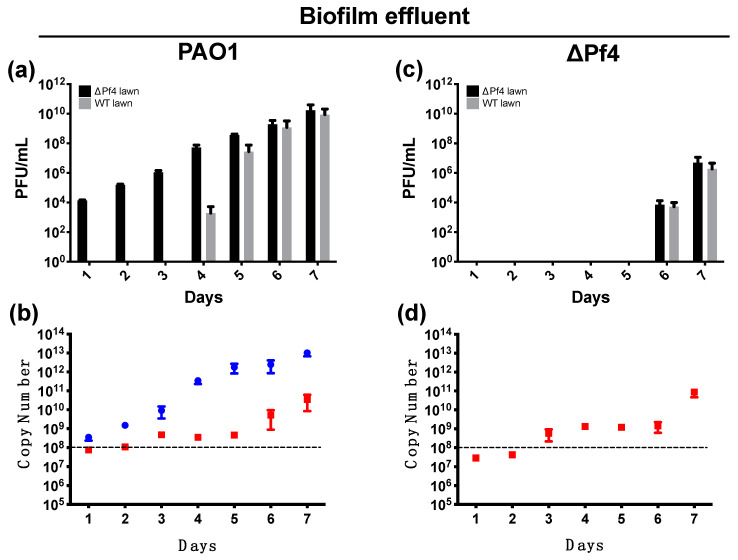
Figure 1.
Phage production from biofilms formed by wild-type PAO1 (a,b) and the PAO1∆Pf4 mutant (c,d). The bars in black (■) represent the phage titre of the biofilm on a PAO1ΔPf4 top layer agar, while the bars in grey (■) represent the biofilm phage titre on a PAO1 top layer agar (a,c). The points in blue (●) and in red (■) indicate the amounts of Pf4 or Pf6 DNA, respectively, detected in the biofilm effluent (c,d). The amounts of phage DNA are represented as the calculated copy numbers and the limit of detection of 1 × 10⁸ (indicated by the dashed line, ---). The biofilms were developed over 7 d. The error bars represent standard deviations. For all figures, there were 3 biological replicates with 3 technical replicates for each, i.e., N = 3 and n = 3.

