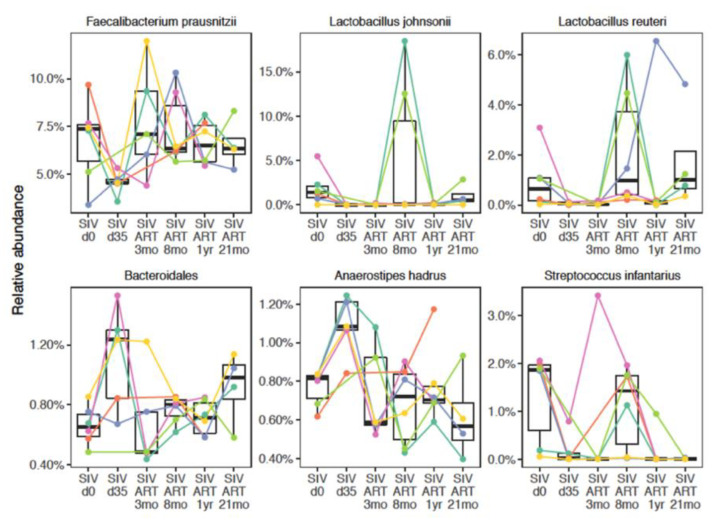
Figure 4.
Relative abundance at species level through the course of SIV-ART. Bacterial species showing either a reduction in abundance at d35 post-SIV infection compared to baseline (SIV.d0), and recovery at 3–8 months of ART, or an increase in abundance at d35 post-SIV infection compared to baseline (SIV.d0) and a return to baseline at 3–8 months of ART.

