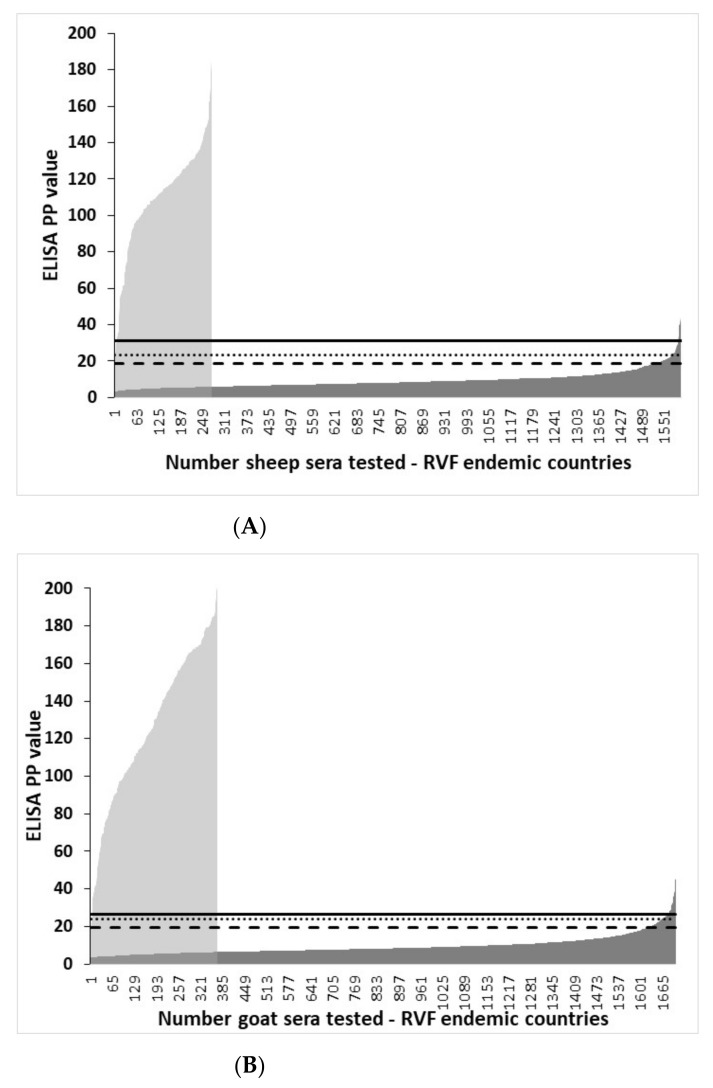
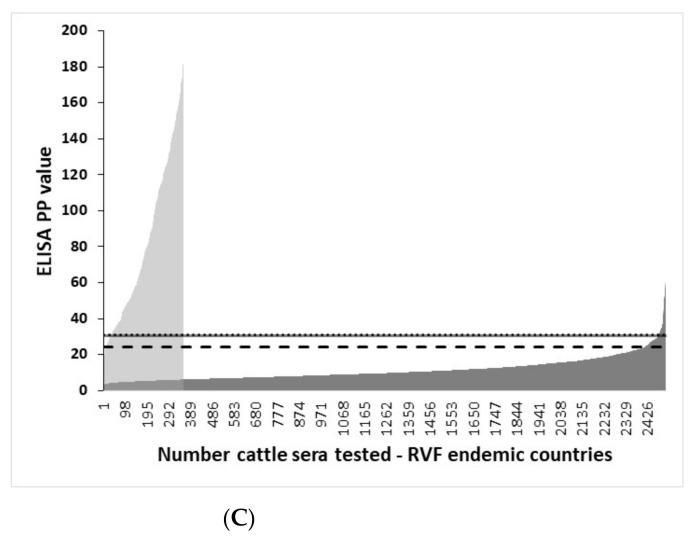
Figure 3.
The effect of different I-ELISA cut-off values on the categorization between sera from RVF-endemic countries tested positive or negative in the virus neutralization test. Distribution of IgG I-ELISA PP values in sera tested positive in VNT (grey area): (A) sheep (n = 275), (B) goats (n = 369), and (C) cattle (n = 356). Distribution of IgG I-ELISA PP values in sera tested negative in VNT (dark area): (A) sheep (n = 1874), (B) goats (n = 2072), and (C) cattle (n = 2864) in the VNT. Sera ordered according to ELISA PP values. Vertical lines indicate the ELISA cut-off values determined by the TG-ROC analysis (solid line), and as mean plus three (dotted line) and two (slashed line) standard deviations observed in the VNT-negative sera.


