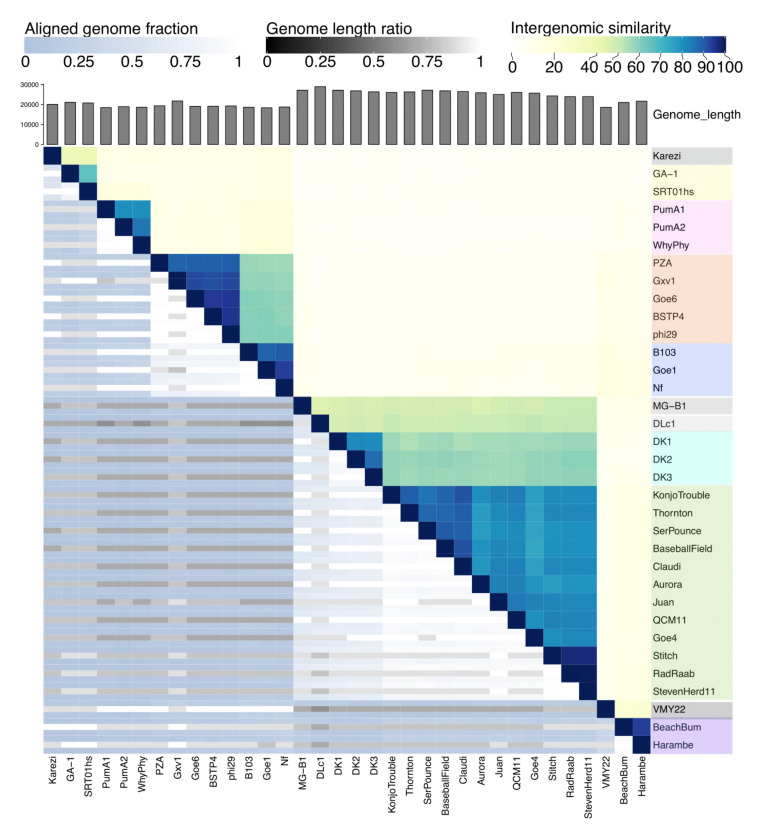
Figure 3.
VIRIDIC heatmap of the 34 phi29-like phages. Intergenomic similarities of the phages are shown on the right side with the colored scale where more defined clusters are seen compared to the dot plot. The similarities scores are found in Table S2. The aligned genome fraction and genome length ratio values are shown on the left side with their corresponding scales. Overlayed is the color coding of the seven major clusters, where grey indicates singleton phages.

