Figure 2.
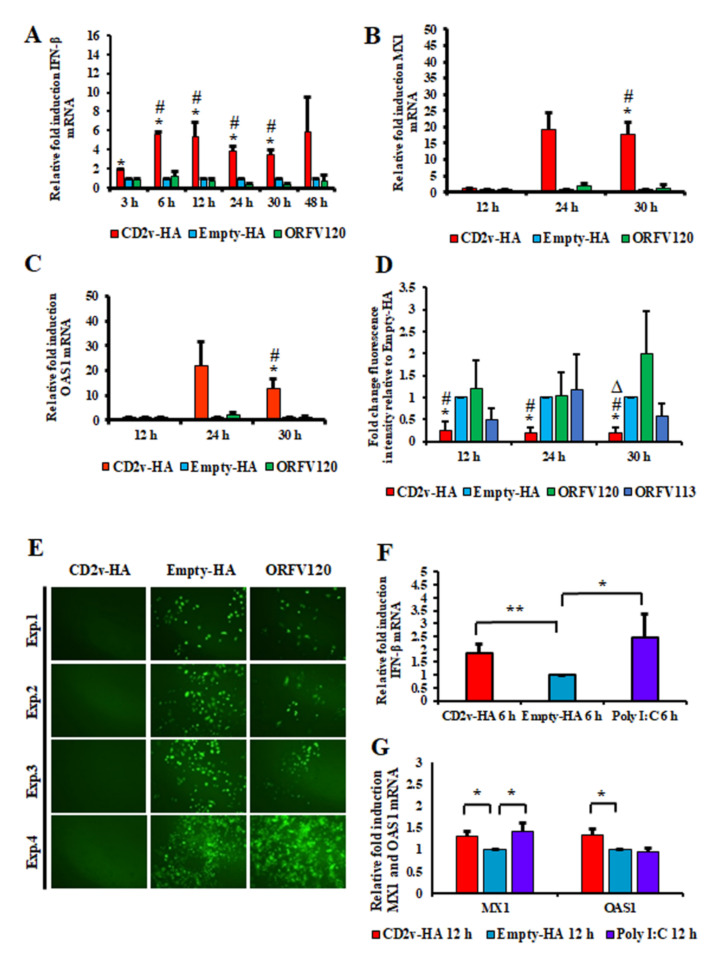
Induction of IFN-β, ISGs and the antiviral state in CD2v-expressing cells. PK15 cells were transfected with plasmids pCD2v-HA or controls pEmpty-HA and pORFV120-Flag (an unrelated viral transmembrane protein control) and transcription of IFN- β and selected ISGs was assessed by real-time PCR. (A) Shown are fold changes of IFN-β levels in cells transfected with pCD2v-HA relative to pEmpty-HA and pORFV120-Flag at various times pt. Results are the average mRNA levels from three independent experiments with p-values relative to controls < 0.05 at 3–30 h times pt. (B,C) Shown are fold changes of ISG mRNA levels at 12 h, 24 h and 30 h pt. Results are the average mRNA levels from three independent experiments. p-values relative to Empty-HA and ORFV120 at 30 h pt were 0.02 and 0.018 for MX1 (B) and 0.04 and 0.037 for OAS1 (C). * and # denote statistical significance compared to Empty-HA and ORFV120, respectively. (D,E) PK15 cells were transfected with pCD2v-HA, pEmpty-HA or control plasmids (pORFV120-Flag or pORFV113-Flag). At 12 h, 24 h or 30 h pt, cultures were infected with vesicular stomatitis virus expressing GFP (VSVGFP, 50 PFU/well). (D) Mean GFP fluorescence measured by flow cytometry at 16 h post infection. Results are the mean values of four independent experiments. p-values relative to transfection with control plasmids were < 0.05 at all times examined. *, # and ∆ denote statistical significance compared to Empty-HA, ORFV120 and ORFV113, respectively. (E) Fluorescence microscopy images taken at 16 h post infection with VSVGFP. Note decreased VSV replication in cells transfected with pCD2v-HA relative to controls. Results are representative of four independent experiments. Exp. denotes the experimental replicates. (F) Fold changes of IFN-β levels in swine macrophages transfected with pCD2v-HA relative to pEmpty-HA at 6 h pt. Results are the average from five independent experiments. p-value relative to Empty-HA was 0.008 for CD2v-HA. (G) Fold changes of ISG mRNA levels at 12 h pt. Results are the average from four independent experiments. p-values for CD2v-HA relative to Empty-HA were 0.014 for MX1 and 0.03 for OAS1, respectively (*, p < 0.05; **, p < 0.01).

