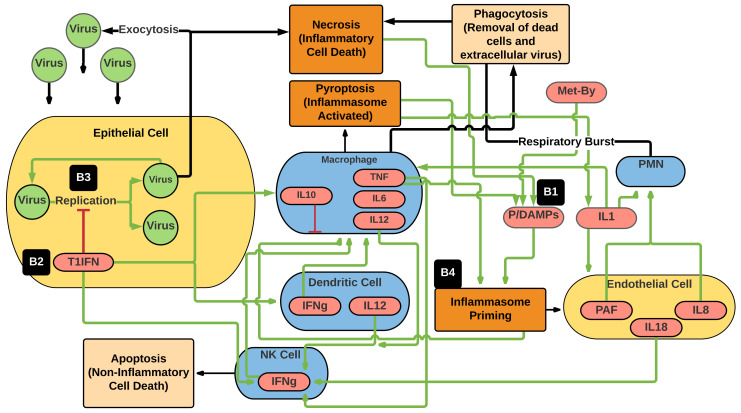
Figure 1.
Schematic of the main cell types, mediators, interactions, and functions represented in the CBIABM. Blue ovals represent immune cell types; yellow ovals represent non-mobile cells; green circles represent virus; red ovals are molecular species; beige rectangles represent non/anti-inflammatory processes; orange rectangles represent proinflammatory processes. Green arrows represent positive or stimulatory interactions; red connectors represent negative or inhibitory interactions; black arrows represent cellular functions facilitated by the connected cell types. Note that the primary means of suppressing viral infection is through the death of infected epithelial cells, either by apoptosis or necrosis; both pathways lead to decreased numbers of healthy epithelial cells (%System-Health). In addition, note that the differences in bat and human parameterization are seen at: B1 = increased P/DAMPS by the addition of higher metabolic byproduct (Met-By) reflecting increased metabolism in bats, B2 = baseline production of type 1 interferons (T1IFN), B3 = enhanced antiviral effect of T1IFNs and B4 = decreased inflammasome activity. T1IFN = type 1 interferons, P/DAMPS = pathogen/damage-associated molecular patterns, Met-By = metabolic byproduct, PAF = platelet-activating factor, IL1 = interleukin 1, IL2 = interleukin 2, IL6 = interleukin 6, IL10 = interleukin 10, IL12 = interleukin 12, TNF = tumor necrosis factor, IFNg = interferon-gamma, PMN = polymorphonuclear neutrophil, NK cell = natural killer cell.

