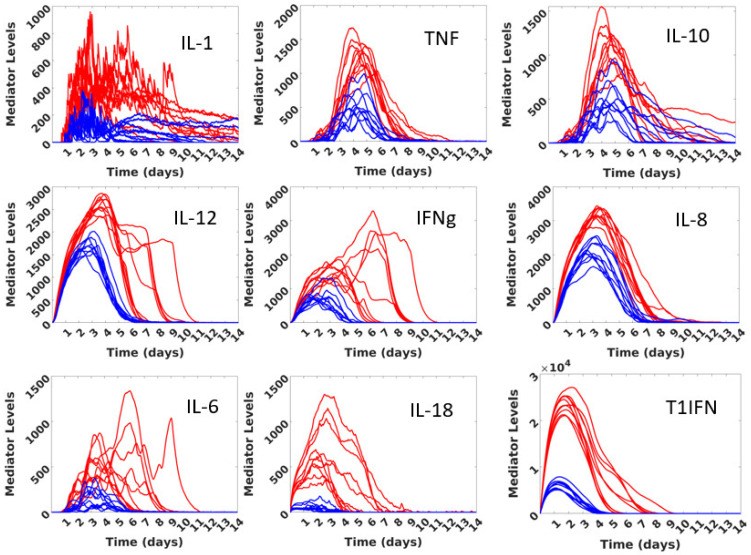
Figure A1.
Trajectories for every represented mediator in the CBIABM, excepting PAF, ROS, and P/DAMPs; the reason these are not displayed is that they are very local mediators not generally or reliably measured systemically. The values on the Y-axes of these plots are unitless, with the rationale relayed in Appendix A. The blue lines are mediator trajectories from n = 10 stochastic replicates at an initial inoculum = 75 corresponding to moderate disease severity, whereas the red lines are mediator trajectories from n = 10 stochastic replicates at an initial inoculum = 150 corresponding to severe disease severity. Given the representation of a generic virus in the CBIABM, these plots all demonstrate plausible trajectories corresponding to the assumed onset of symptoms at ~3 days, with expected higher values and generally increased durations with greater initial inoculum and disease severity. Note that the absence of T cells in the current version of the CBIABM means their contributions to the levels of these mediators are not present and not reflected in these trajectories beyond ~day 7. These simulations also demonstrate the effect of stochastic processes in variation in the trajectories, consistent with the heterogeneity present within experimental data and clinical populations. IL-1 = interleukin-1, TNF = tumor necrosis factor, IL-10 = interleukin-10, IL-12 = interleukin-12, IFNg = interferon-gamma, IL-8 = interleukin-8, IL-6 = interleukin-6, IL-18 = interleukin-18, T1IFN = type 1 interferons.

