Summary
Adaptive behaviour necessitates that memories are formed for fearful events, but also that these memories can be extinguished. Effective extinction prevents excessive and persistent reactions to perceived threat, as can occur in anxiety and ‘trauma- and stressor-related’ disorders1. However, while there is evidence that fear learning and extinction are mediated by distinct neural circuits, the nature of the interaction between these circuits remains poorly understood2–6. Here, through a combination of in vivo calcium imaging, functional manipulations, and slice physiology, we demonstrate that distinct inhibitory clusters of intercalated neurons (ITCs) located in the amygdala exert diametrically opposite roles during the acquisition and retrieval of fear extinction memory. Furthermore, we find that the ITC clusters antagonize one another via mutual synaptic inhibition and differentially access functionally distinct cortical- and midbrain-projecting amygdala output pathways. Our findings show that the balance of activity between ITC clusters represents a unique regulatory motif orchestrating a distributed neural circuitry regulating the switch between high and low fear states. This suggests a broader role for the ITCs in a range of amygdala functions and associated brain states underpinning the capacity to adapt to salient environmental demands.
Animals are equipped with biological systems to detect and defend against environmental threats. Through associative learning, stimuli predicting threat mobilize defensive responses to mitigate harm7. When threat-associated stimuli become innocuous, responses adapt through the process of extinction, whereby a new memory is formed that coexists in opposition to the original fear memory4,8,9. Specialized neural systems have evolved to subserve fear and extinction which, when imbalanced, cause persistent reactions to threat.
ITC clusters are densely packed GABAergic neurons surrounding the basolateral amygdala (BLA), distinguished from neighbouring neurons by their electrophysiological and molecular properties10–13. The medial ITC clusters, located in the intermediate capsule at the BLA-central amygdala (CeA) junction, receive BLA input and modulate CeA activity through feed-forward inhibition2,14 in a manner potentiated by extinction15. Though medial ITC ablation impairs extinction16, recent studies suggest functional10 and anatomical17,18 heterogeneity between medial ITC clusters. However, given their small size and location deep in the brain, elucidating ITC cluster functions has proven challenging.
ITC clusters signal an aversive stimulus
We employed in vivo deep-brain imaging to monitor Ca2+ activity in individual ITC neurons in freely-moving mice, via a miniaturized microscope19. We separately targeted neurons in the dorsal cluster ITCdm and ventral cluster ITCvm (corresponding to previously defined Imp and IN10, respectively; for detailed anatomical demarcation of the clusters, see Extended Data Fig. 1, Supplementary Movie 1, and Supplementary Table 1). To target ITCdm, BLA, and CeA, an adeno-associated virus (AAV) encoding a Ca2+ indicator, GCaMP6f, was injected into amygdala (Extended Data Fig. 2a–c), and a graded refractive index (GRIN) lens implanted (Fig. 1a,b). To isolate ITCdm Ca2+ responses, we selected IHC-labelled FoxP2+ neurons from GRIN lens images for analysis by registering maximum intensity projection Ca2+ images to 3D confocal images of cleared tissue (Fig. 1c–e, Supplementary Movie 2, see Methods).
Fig. 1 |. ITC clusters differentially signal the presence and absence of an aversive stimulus.
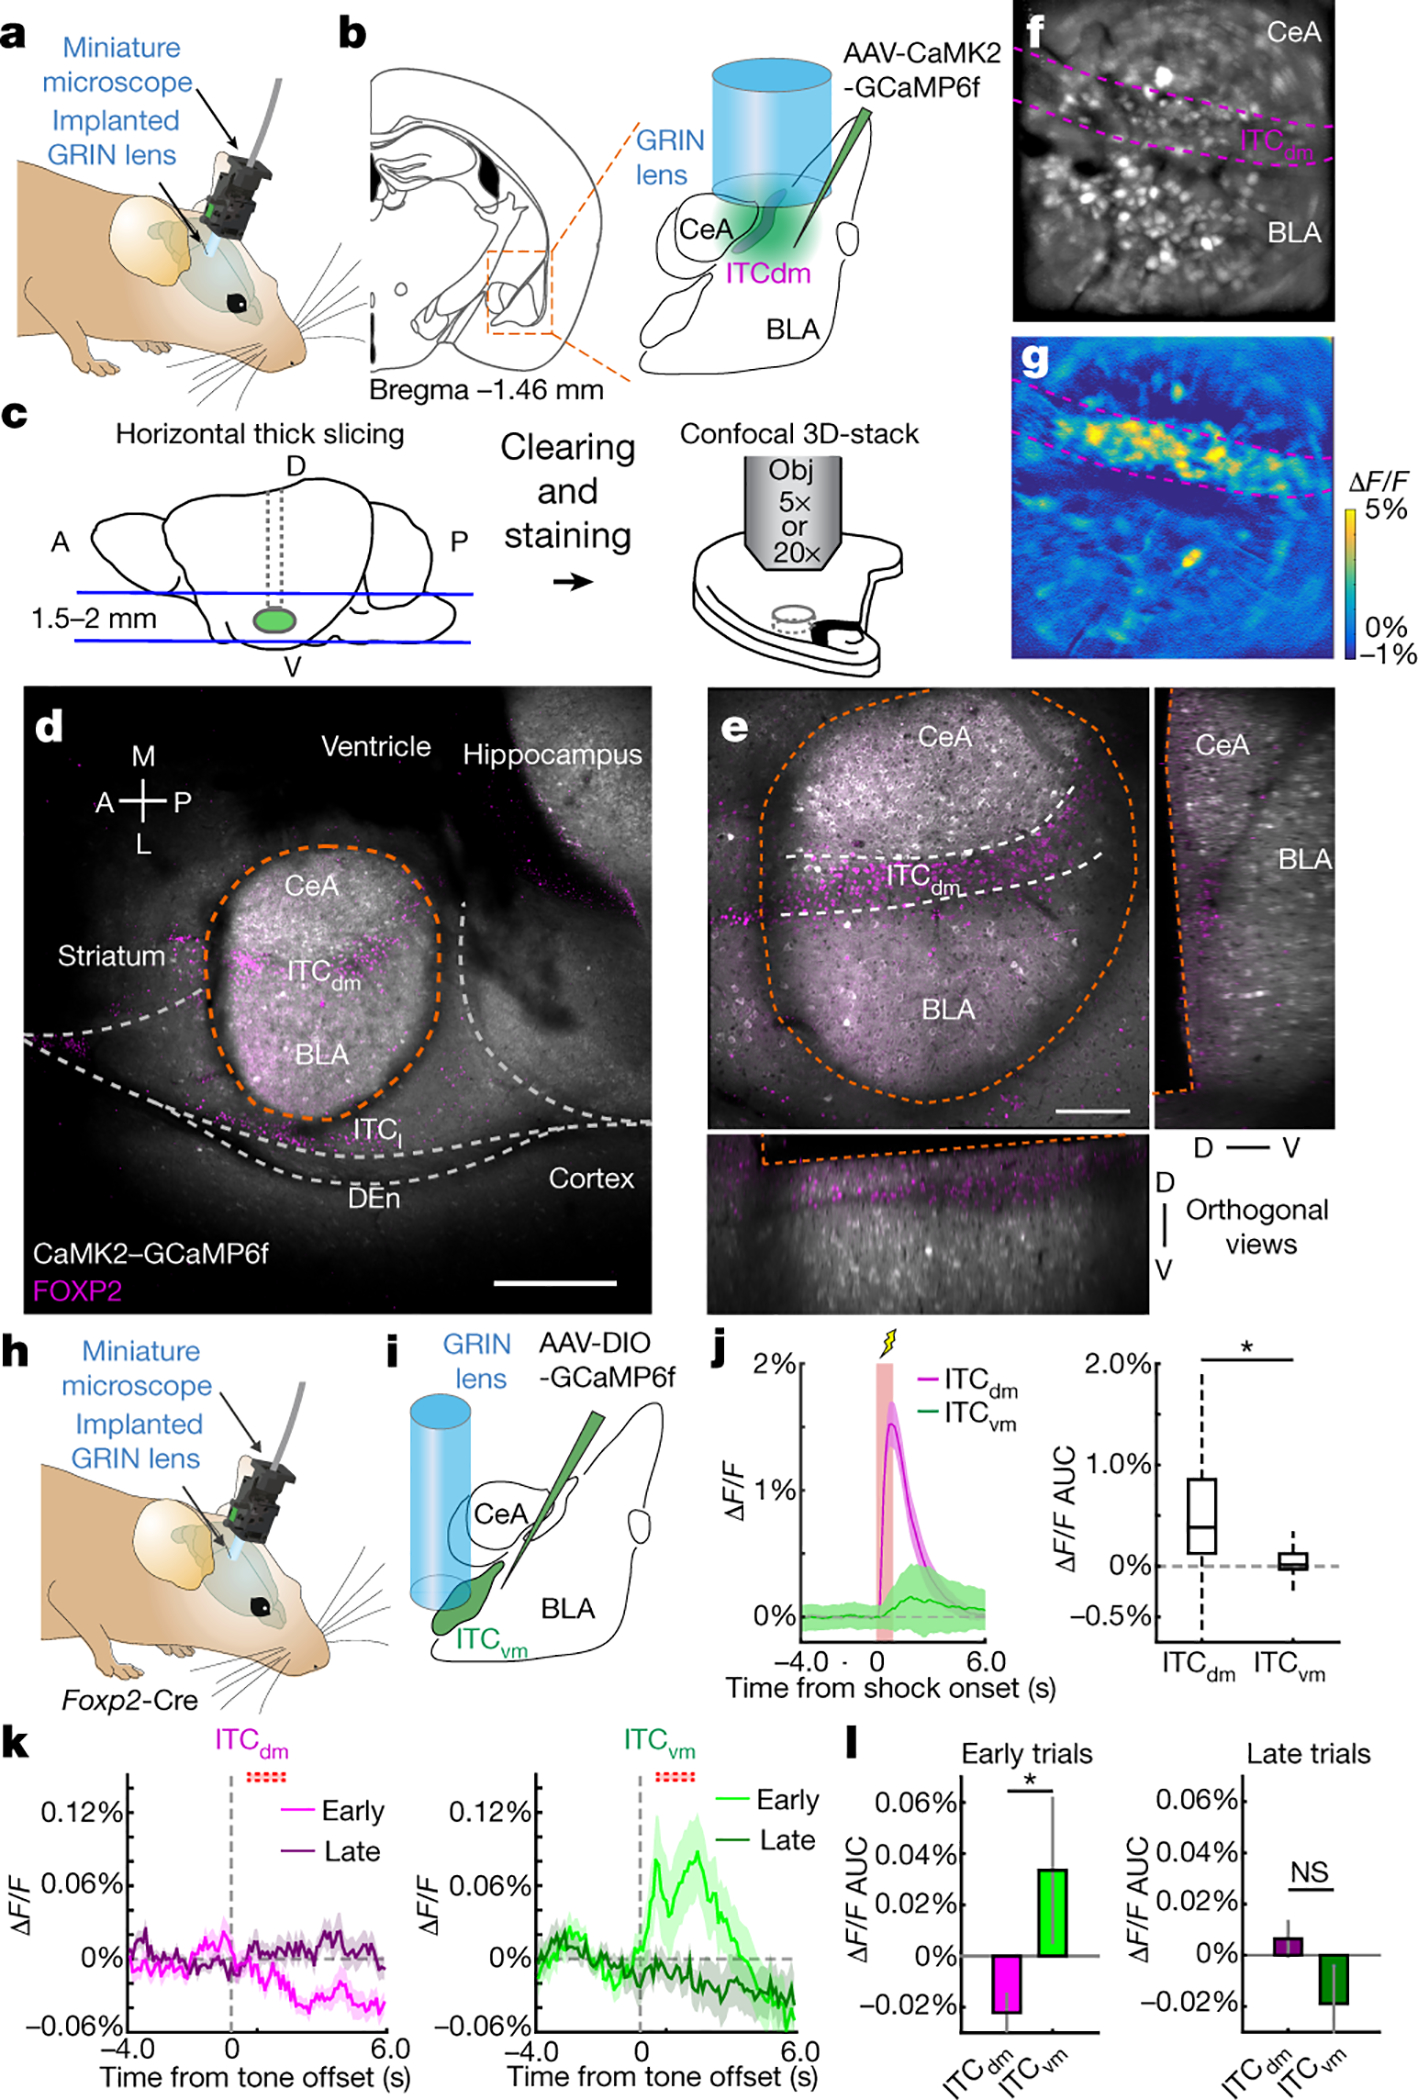
a, Endoscopic imaging with a miniaturized microscope in a freely-moving mouse.
b, AAV encoding CaMK2-GCaMP6f targeted to CeA, BLA and ITCdm. GRIN lens implanted above injection site.
c, Post-hoc identification of ITCdm neurons. Left: FOV-containing horizontal sections cleared (CUBIC protocol) and immunostained with anti-FoxP2 antibody. Right: Confocal images of sections. Gray lines: GRIN lens position.
d, Confocal image of tissue acquired with 5x objective (from mouse in f,g). Orange dotted line indicates outline of GRIN lens implanted area. Scale bar: 500 μm. Str.: Striatum; Vent.: Ventricle; DEn: Dorsal endopiriform nucleus; Hip.: Hippocampus; Sub.: Subiculum
e, Sample shown in d, acquired with 20x objective. XZ and YZ orthogonal views visualized in an isotropic manner. Scale bar: 250 μm. See also Supplementary Movie 2. Repeated for N=9 mice.
f, Maximum-intensity projection image of BLA, CeA, and ITCdm neurons acquired with a miniature microscope. Dashed magenta lines indicate FoxP2-positive area in f with dashed white lines (identified as ITCdm). Image approximates to 600 × 600 μm.
g, A ΔF/F map showing clustered ITCdm activation. See also Supplementary Movie 3.
h, Miniature microscope imaging in a freely-moving mouse.
i, AAV encoding CAG-DIO-GCaMP6f was targeted to ITCvm. GRIN lens implanted above injection site.
j,Left: Averaged Ca2+ footshock US responses (red shading) in all recorded ITCdm (magenta, n=271 neurons, 9 mice) and ITCvm neurons (green, n=372 neurons, 6 mice). Right: Averaged ΔF/F values. *P=2.1 × 10⁻³², Wilcoxon rank-sum test. Box plot represents median, 25th and 75th percentiles, whiskers represent data-range.
k, Trial-averaged ΔF/F Ca2+ timecourse of all recorded ITCdm (left) or ITCvm (right) neurons during US omission on first and last 5 trials. Dotted red boxes indicate expected US delivery.
l, Averaged ΔF/F responses to US omission on first (left) and last 5 trials. Error bars: mean±SEM.
*P=0.0039, N.S.: P=0.98, Two-sided Wilcoxon rank-sum test.
Data in j-l obtained from same animals in Fig. 2.
Implanted mice were tested in a 5-day fear conditioning/extinction paradigm (see Methods and Fig. 2a). We first limited analysis to shock-evoked Ca2+ responses during fear conditioning (Day2) – comprising 5 pairings of an auditory conditioned stimulus (CS) with a footshock unconditioned stimulus (US). Footshocks reliably elicited strong responses in ITCdm neurons (Fig. 1f,g,j, Extended Data Fig. 2d, Supplementary Movie 3) whereas simultaneously recorded neurons in CeA and BLA exhibited sparse and heterogeneous responses (Fig. 1f,g, Extended Data Fig. 2d). In vivo 2-photon Ca2+ imaging performed in head-fixed mice, providing higher spatial resolution and simultaneous cell-type identification, confirmed most ITCdm neurons responded to shock (84.5%, 93/110 neurons, N=5 mice, Extended Data Fig. 3a–e). By contrast, ITCvm neurons did not show footshock responses (Fig. 1h–j, Extended Data Fig. 2e–h). The fraction of shock-responsive ITCvm neurons was smaller than for ITCdm (P = 1.6 × 10−48, Chi-squared test). ITCdm, not ITCvm, activity was also highly correlated during conditioning and a home-cage session (Extended Data Fig. 2i–n). Furthermore, dual-colour in vivo fibre photometry simultaneously measuring activity of ITCdm and ITCvm projections in BLA found their activity was largely anti-correlated (Extended Data Fig. 3f–j).
Fig. 2 |. CS responses of ITC clusters parallel the switch from high to low fear state.
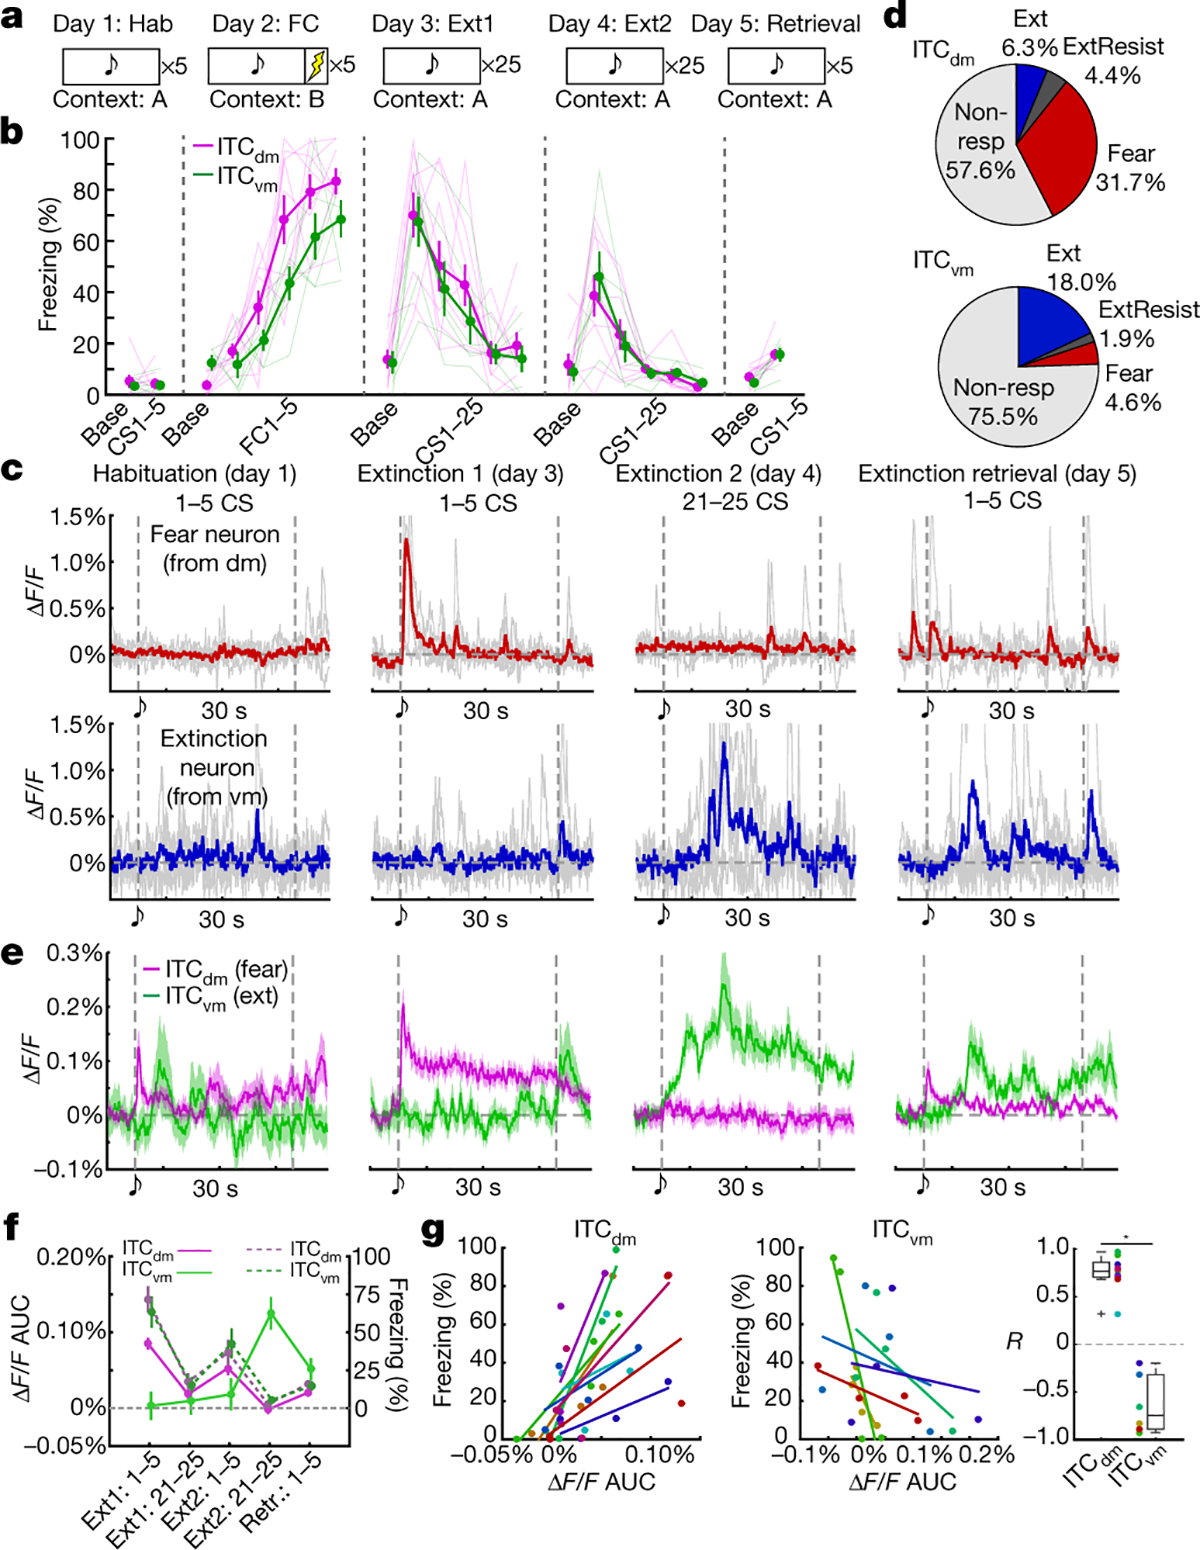
a, 5-day fear conditioning and extinction paradigm.
b, Freezing in ITCdm (magenta, N=9) and ITCvm targeted (green, N=6) mice.
ITCdm: FC1–5: P=4.7*10−9 (ascend); Ext1 CS1–25: P=4.2*10−7 (descend); Ext2 CS1–25: P=1.9*10−9 (descend); ITCvm: FC1–5: P=1.8*10−7 (ascend); Ext1 CS1–25: P=3.9*10−5 (descend); Ext2 CS1–25: P=7.5*10−6 (descend); Jonckheere-Terpstra test for trend. Error bars: mean±SEM
c, Ca2+ traces of Fear and Extinction neurons from ITCdm and ITCvm, respectively. 5-trial averaged traces in colour and traces from individual trials in gray.
d, Fractions of Fear, Extinction, and Extinction Resistant neurons in ITCdm (n=271 neurons, 9 mice) and ITCvm (n=372 neurons, 6 mice). P=6.3 × 10⁻²⁰, Chi-squared test. Fear neurons: P<0.01; Extinction neurons: P<0.01; Extinction Resistant neurons: P>0.10.
e, Averaged Ca2+ responses to CSs in ITCdm fear (magenta, n=86) and ITCvm extinction (green, n=67) neurons. Vertical dotted lines indicate CS onset and offset. For responses in entire recorded population, including task phase-classified neurons shown here, aligned and baseline-normalized to CS-offset, see Fig. 1k.
f, Averaged ΔF/F values (solid lines) and freezing (dotted lines) from ITCdm and ITCvm targeted mice during each test stage. Error bars: mean±SEM
g, Relationships between 5-trial averaged ΔF/F values (as in panel f) and freezing during each test stage, for ITCdm Fear (Left) and ITCvm Extinction (Center) neurons. Data points (5 per mouse, 1 per stage) and lines (linear regression fitted) colour-coded by individual mouse (ITCdm: N=9; ITCvm: N=6). R (correlation coefficient) fitted lines (Right); dots coloured as in left panels. *P=4.0 × 10⁻⁴, Wilcoxon rank-sum test. Box plot represents median, 25th and 75th percentiles, whiskers represent data-range.
As extinction is based on the absence of an expected aversive stimulus20,21, and ITCs are ascribed a role in extinction2,16, we asked whether the clusters differentially respond to shock omission. We examined extinction training (Day3, see Methods and Fig. 2a), where the CS was presented without the US (25x), and aligned Ca2+ traces to CS-offset (when footshocks were delivered during conditioning). During the first 5 CS/no-US trials, the fraction of neurons responding to US-omission was greater in ITCvm (28%) than ITCdm (4%; P=5.8 × 10⁻¹⁵, Chi-squared test), as was the average size of the response (Fig. 1k,l, Extended Data Fig. 3k,l). On late extinction training (trials 21–25), shock-omission responses in ITCvm were markedly reduced, consistent with representing deviations from expectation.
These data demonstrate ITCdm and ITCvm neurons oppositely represent the presence and absence of an aversive stimulus. Opposing functional profiles likely reflect differential connectivity with upstream brain regions; e.g., ITCdm shock responses could be driven by multisensory and pain processing areas, including the medial geniculate nucleus/posterior intralaminar nucleus thalamic complex17,22.
ITC clusters track fear state switches
Do ITC clusters exhibit differential fear state-dependent responses to conditioned CSs? We measured Ca2+ activity in ITCdm and ITCvm neurons during CS/context habituation (Day1), CS-US conditioning (FC, Day2), CS-only extinction training (Ext1, Day3, Ext2, Day4) and extinction retrieval (Retrieval, Day5) (Fig. 2a, see Methods). CS-elicited freezing, a readout of fear state, increased over conditioning and was maintained at fear retrieval (early extinction Day3 trials) before decreasing with extinction training, and remaining low on extinction retrieval (Fig. 2b).
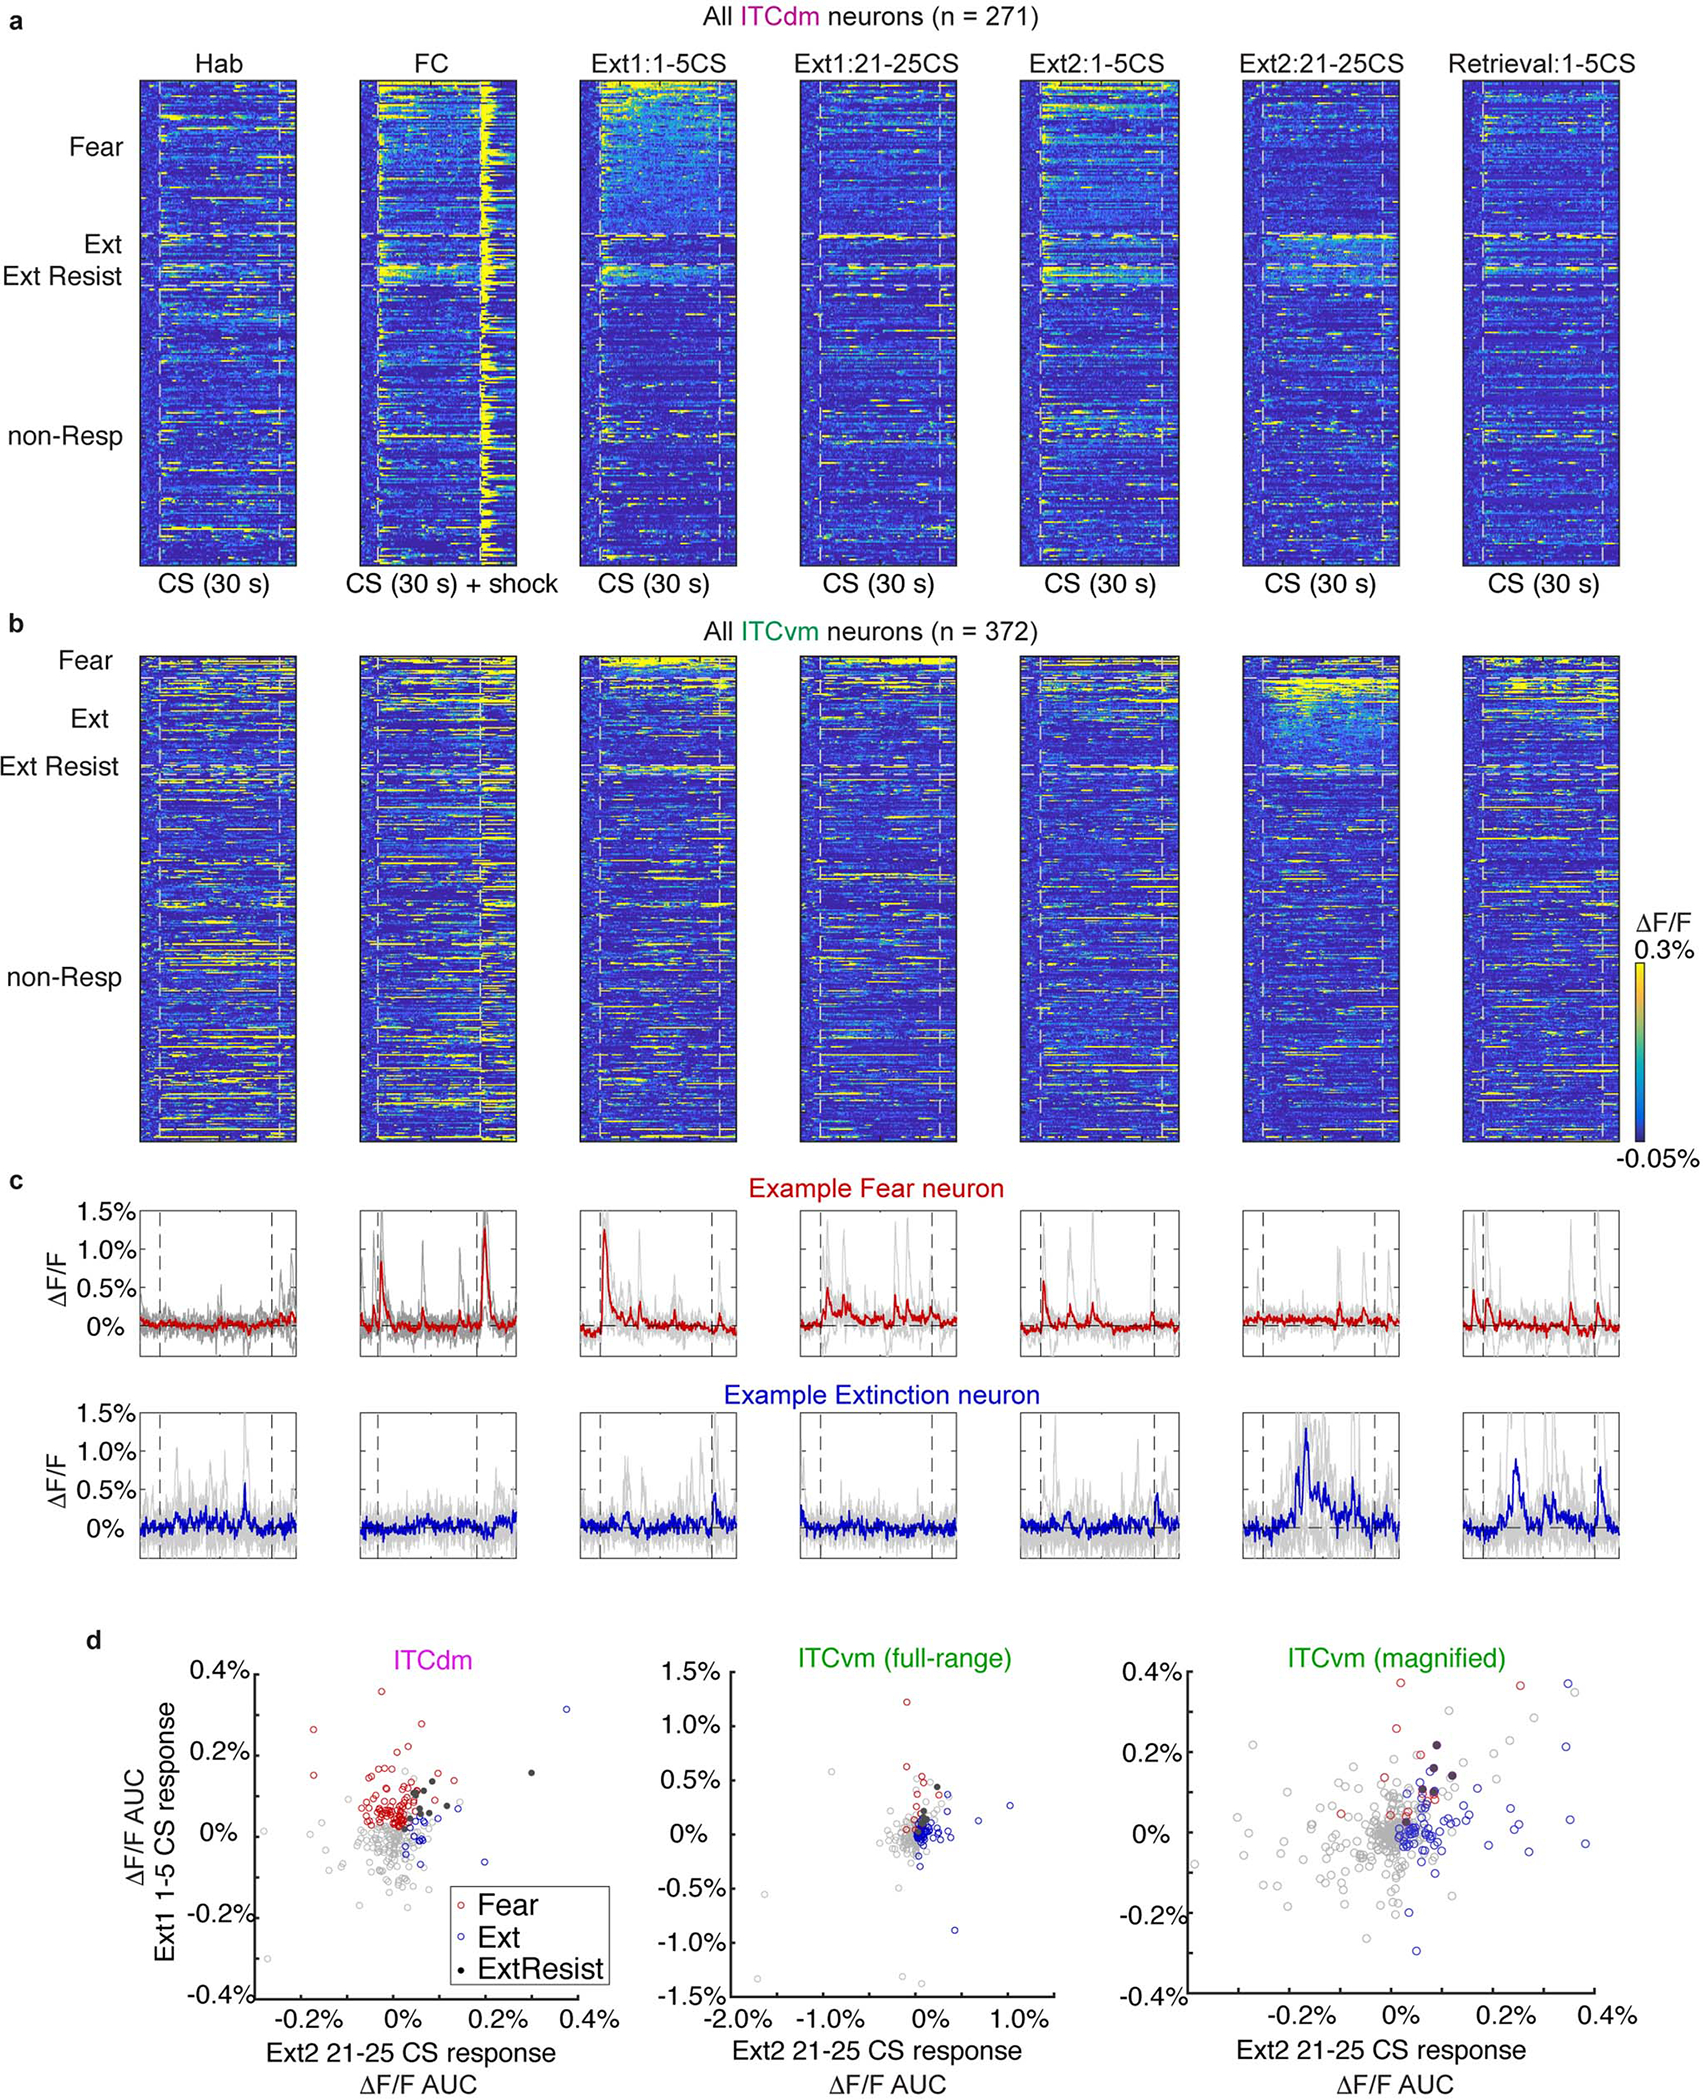
We functionally classified ITC neurons into three mutually exclusive categories (as for BLA neurons23). Fear neurons were selectively active during fear retrieval/early extinction, Extinction neurons developed responses by late extinction, and Extinction-resistant neurons showed sustained activity across extinction training (Fig. 2c, Extended Data Fig. 4a–c, see Methods). ITCdm contained a large fraction of Fear neurons (75% CS-responsive/32% recorded), but a small fraction of Extinction neurons (15% CS-responsive/6% recorded, P<0.01) (Fig. 2d, Extended Data Fig. 4d). Conversely, Extinction neurons were overrepresented in ITCvm (74% CS-responsive/18% recorded), with a much smaller fraction of Fear neurons (18% of CS-responsive/5% of recorded). There was only a small fraction (<5%) of Extinction-resistant neurons in each cluster.
Examining response dynamics revealed most ITCdm-Fear neurons showed an onset-locked CS response during early extinction, suggesting rapid detection of the CS’s aversive properties. CS responses were much reduced at extinction retrieval (Fig. 2e). Conversely, CS-responses in ITCvm-Extinction neurons emerged by the second extinction training session (Day4) and were maintained on extinction retrieval (Day5) (Fig. 2e). This delayed increases suggests prolonged extinction training and/or overnight extinction consolidation is required to recruit ITCvm-Extinction neurons (as in BLA23).
Further indicating divergent activity in the clusters, the overall amplitude of CS-responses positively correlated with freezing in ITCdm-Fear neurons, but anti-correlated with freezing in ITCvm-Extinction neurons (Fig. 2f,g). These correlations were not evident at freezing onset and offset specifically (Extended Data Fig. 5a). Importantly, these relationships held when considering all recorded (not only classified) neurons (Extended Data Fig. 5b,c). ITCvm neurons did not show tone responses on habituation (Day1), indicating ITCvm activity does not simply reflect a low fear state, but represents a diminished fear state produced by extinction (Extended Data Fig. 5d). In contrast, ITCdm neurons showed tone responses on habituation (Day1), which rapidly reduced across 5 trials, suggesting a habituation-like response to novelty (Extended Data Fig. 5e).
When aligning responses to US-omission, ITCvm-Extinction, but not ITCdm-Fear neurons showed strong responses (Extended Data Fig. 5f). This is consistent with the shock-omission responses observed for the entire recorded ITCvm population on test Day3 (Fig. 1k,l), which had decreased by Day5 (Extended Data Fig. 5g). Indeed, US-omission responses were weakly positively correlated with extinguished (Day4) CS-responses (R = 0.36), suggesting functional overlap between ITCvm neurons signalling US-omission and extinction (Extended Data Fig. 5h). Hence, a prevailing fear state is represented by the relative balance of ITCdm and ITCvm neuron activity.
To assess whether interplay between ITC clusters is evident in other situations characterized by a shift in behavioural state, we used dual-cluster in vivo fibre photometry to simultaneously record ITCdm and ITCvm Ca2+ activity in an elevated zero-maze (Extended Data Fig. 6a). Transitions between quadrants corresponded to a marked shift in the balance of activity in the two clusters; ITCvm activity increased during transitions from the protected, closed, to the unprotected, open, quadrants (Extended Data Fig. 6b–e). This increase might serve to inhibit defensive behaviour and enable open quadrant exploration, analogous to the inhibition of freezing following extinction. Hence, these data suggest shifts in ITC cluster activity correspond to transitions between defensive and explorative behavioural states across paradigms.
ITC clusters regulate fear extinction
We next assessed the causal effects of manipulating the balance of ITC cluster activity, using in vivo chemogenetics. A Cre-dependent form of the Gi-coupled kappa-opioid receptor DREADD (KORD) was expressed in ITCdm or ITCvm of FoxP2-Cre mice and Cre-negative controls (Fig. 3a–f). The pharmacologically inert ligand salvinorin B (SalB) was systemically injected to selectively inactivate either cluster (for functional verification via ex vivo neuronal recordings in acute brain slices and targeting success rates, and statistics, see Extended Data Fig. 7–9, Methods, and Supplementary Table 2).
Fig. 3 |. ITC clusters differentially and bidirectionally regulate fear extinction.
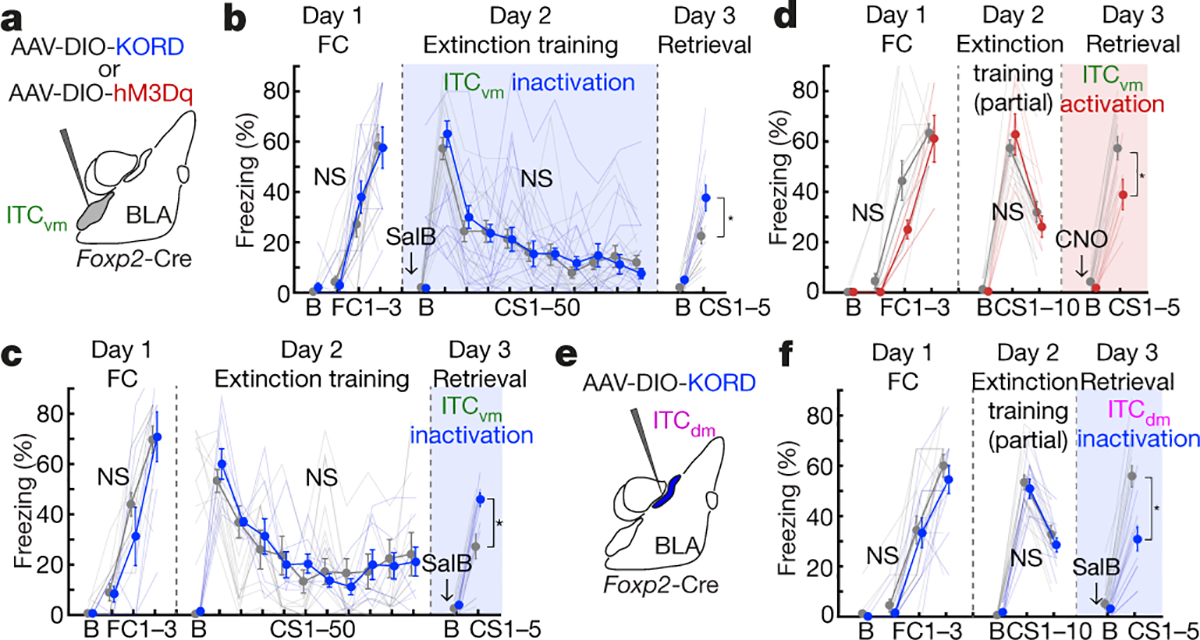
a,e, Chemogenetic manipulations of individual ITCs.
b,c, ITCvm inactivation. Freezing in Cre+ and Cre− controls (injected with same AAV and ligand). Arrows and colour-shadings indicate timing of SalB administration relative to full (50-trial) extinction training (b) or retrieval (c). Freezing on retrieval in b: Cre+: 37.6±5.2%; Cre−: 22.5±3.1%; *P=0.0013; in c: Cre+: 45.8±2.7%; Cre−: 27.3±4.9%; *P=0.0005
d, ITCvm activation. Freezing in Cre+ and Cre− mice. Freezing on retrieval: Cre+: 38.9±6.1%; Cre−: 57.3±4.6%; *P=0.0079
f, ITCdm inactivation. Freezing on retrieval: Cre+: 30.9±4.8%; Cre−: 55.8±4.2%; *P<0.0001
Repeated measures ANOVA, Sidak post-hoc test. Error bars: mean±SEM. N.S.: not significant differences on Day1 or Day2 freezing.
ITCvm inactivation during extinction training impaired extinction memory formation, as evidenced by higher CS-related freezing in Cre+ versus Cre− mice on (drug-free) extinction retrieval (Fig. 3b). In a separate experiment, ITCvm inactivation during extinction retrieval, not acquisition, impaired retrieval (Fig. 3c). Thus, ITCvm is necessary for extinction memory formation and retrieval. Next, we used the Gq-coupled DREADD, hM3Dq and systemic clozapine-n-oxide (CNO) injection to activate ITCvm neurons during extinction retrieval (Fig. 3d). Using a partial extinction training protocol (avoiding freezing floor effects, see Methods), we found activating ITCvm decreased CS-related freezing, relative to Cre− controls, indicating facilitated extinction retrieval. Importantly, selectively expressing hM3Dq or KORD in ITCdm and administering CNO or SalB to respectively activate or inactivate ITCdm during extinction retrieval produced effects opposite to these same manipulations in ITCvm. Specifically, relative to Cre− controls, ITCdm activation increased (Extended Data Fig. 9a,b), whereas ITCdm inactivation decreased, CS-related freezing in Cre+ mice on retrieval (Fig. 3e,f). Finally, when we expressed KORD in ITCdm as well as ITCvm and injected SalB prior to extinction retrieval, retrieval was impaired (Extended Data Fig. 9c–f), consistent with prior evidence that medial cluster-wide pre-retrieval toxin-lesioning impairs extinction retrieval in rats16.
Collectively, these data strongly align with our imaging results showing Fear and Extinction neurons were overrepresented (albeit not exclusively) in ITCdm and ITCvm, respectively.
ITC clusters are mutually inhibitory
We next tested whether the balance of activity between ITCdm and ITCvm was determined by mutual inhibitory interactions. Injecting an AAV expressing Cre-dependent synaptophysin-GFP to target ITCdm or ITCvm in FoxP2-Cre mice (Extended Data Fig. 10a) revealed strong axonal projections and putative synaptic connections in both directions. We saw no somatic expression in projection-target areas, excluding injection leakage and transsynaptic infection (Extended Data Fig. 10b,c). To test for functional GABAergic mono-synaptic connections, we infected ITCdm or ITCvm with an AAV encoding Cre-dependent channelrhodopsin-2 (ChR2) (Extended Data Fig. 10d,e) and photostimulated ChR2-expressing axons in acute brain slices while performing whole-cell patch-clamp recordings of neurons located in the non-injected cluster (Fig. 4a).
Fig. 4 |. ITC clusters exert reciprocal inhibition and selective control over extinction-regulating amygdala outputs.
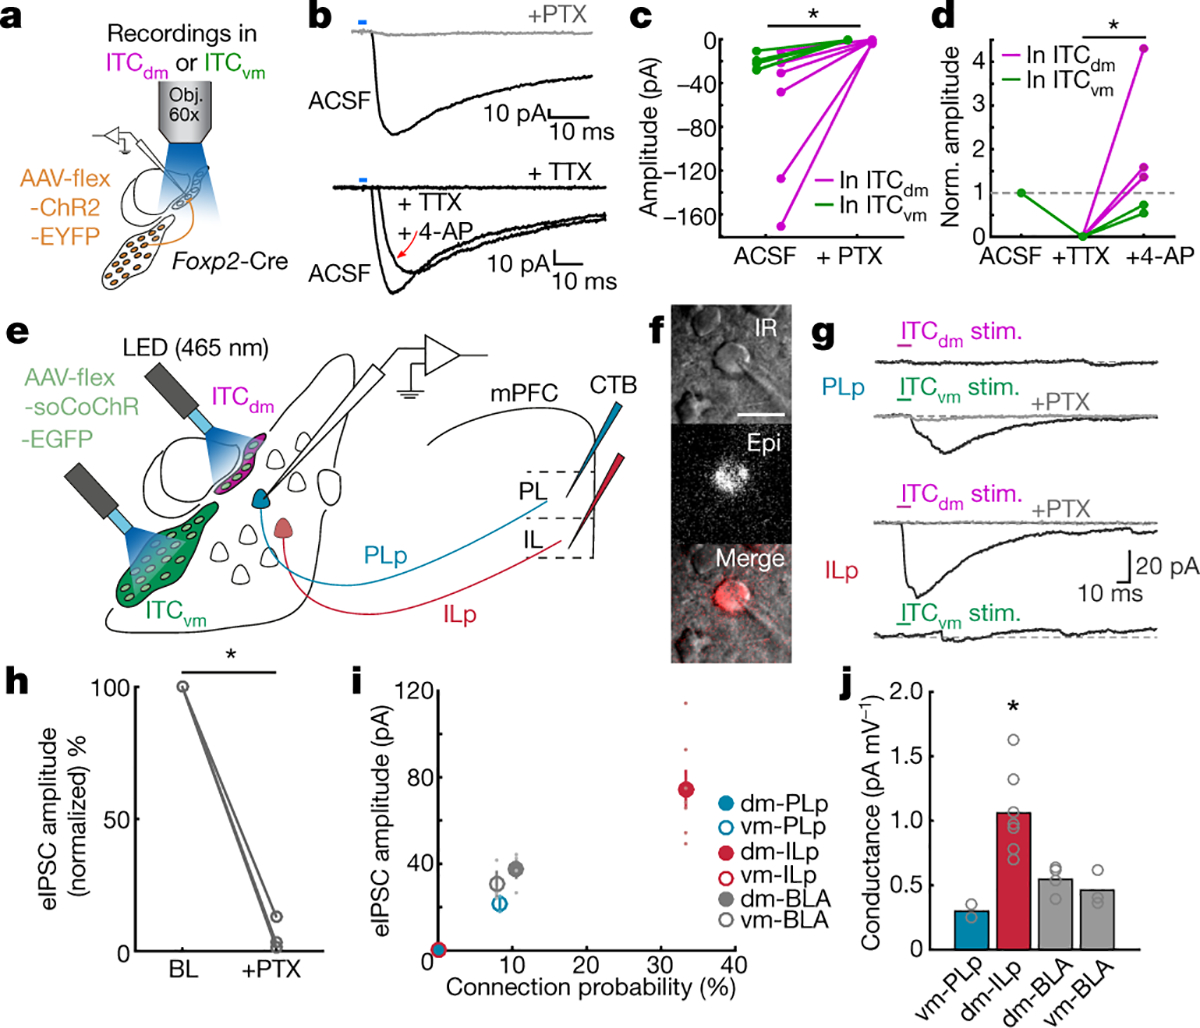
a, Inter-cluster ex vivo electrophysiology. AAV encoding Cre-dependent ChR2-EYFP targeted to ITCvm or ITCdm neurons in FoxP2-Cre mice. Recordings in one ITC cluster while photostimulating ChR2-EYFP-expressing axons from the other cluster.
b, (Top): Example IPSC (−70mV holding potential) evoked by photostimulating ChR2-EYFP-expressing axons. Picrotoxin (PTX) abolished IPSCs. (Bottom): IPSC (−70mV holding potential) evoked by photostimulating ChR2-expressing axons. Mono-synaptic IPSCs were isolated by subsequent application of Tetrodotoxin (TTX)/TTX + 4-Aminopyridine (4-AP).
c, PTX experiments. Magenta lines: ITCvm→ITCdm connections (n=6 neurons, 6 mice); green lines= ITCdm→ITCvm connections (n=5 neurons, 4 mice). *P=0.011, paired t-test.
d, TTX + 4-AP application (ITCvm→ITCdm: n=3 neurons, 3 mice, ITCdm→ITCvm: n=2 neurons, 2 mice). *P=0.029, one-way ANOVA and Tukey-Kramer.
e, Long-range circuit ex vivo electrophysiology. ITCdm and ITCvm neurons targeted with AAV encoding Cre-dependent soCoChR in FoxP2-Cre mice. Two optical fibres placed above ITC clusters. PL- and IL-projecting BLA neurons retrogradely labelled with CTB.
f, CTB-positive BLA neuron under the microscope for slice recordings. Scale bar: 20 μm.
g, IPSCs recorded from PL- (PLp) and IL-projecting (ILp) BLA neurons (−70mV holding potential) evoked by photostimulating soCoChR-expressing ITC clusters. Picrotoxin (PTX) application blocked IPSCs.
h, Mean normalized evoked IPSC before and after PTX application (ITCdm→ILp, ITCvm→PLp, ITCvm→unidentified, total: n=3 neurons, 3 mice). *P=0.030, paired t-test. BL: Baseline.
i, Connection probability and mean evoked IPSC amplitudes from ITC clusters to PL- or IL-projecting and unidentified (CTB−) BLA neurons (PLp: PL-projecting, n = 24 neurons; ILp: IL-projecting, n=21 neurons; unidentified, n=38 neurons). ITCdm→PLp and ITCvm→ILp connections were not observed: datapoints superimposed at o.
j, Synaptic conductance of evoked IPSCs from connected neurons. Slopes calculated from IPSC amplitudes acquired at three different holding potentials (−60, −70, −80mV). *P=0.0028, one-way ANOVA, Tukey-Kramer.
There were synaptic connections in all recorded ITC neurons (ITCvm→ITCdm: n=15/15; ITCdm→ITCvm: n=14/14), demonstrating dense inter-cluster reciprocal connectivity. Optically-evoked synaptic responses were blocked by the GABAA-receptor blocker picrotoxin, and exhibited reversal potentials close to the equilibrium potential for chloride, confirming they were GABAergic IPSCs (Fig. 4b,c, Extended Data Fig. 10f). Synaptic responses persisted on application of the sodium channel blocker tetrodotoxin and potassium channel antagonist 4-AP, demonstrating monosynaptic connectivity (Fig. 4b,d). Using spatially-focused light to directly stimulate individual clusters confirmed these results (Extended Data Fig. 10g–l). Thus, ITCdm and ITCvm are reciprocally and monosynaptically connected by functional inhibitory synapses.
ITC clusters control amygdala outputs
Interconnectivity between ITCdm and ITCvm could provide a mechanism regulating shifts in cluster activity to orchestrate extinction via effects on downstream pathways. To explore this idea, we expressed a Cre-dependent, GFP-fused and soma-targeted opsin, soCoChR-EGFP, in ITCdm and ITCvm of FoxP2-Cre mice (Extended Data Fig. 11a), and selectively photostimulated each cluster in acute brain slices via two thin-fibre-coupled LEDs (Fig. 4e, Extended Data Fig. 11b–k). Stimulation of ITCvm (73% of recorded) but much less so ITCdm (9% of recorded) neurons evoked a postsynaptic response in medial CeA (CeM), a known ITC target24 (Extended Data Fig. 12a–e). Within CeM, ventrolateral periaqueductal gray (vlPAG)-projecting neurons, a fear-promoting pathway25, preferentially received inhibitory input from ITCvm (Extended Data Fig. 12f–i).
Next, we examined ITC outputs to BLA10,17,18, focusing on IL- and PL-projecting neurons given prior evidence that these populations represent extinction-promoting and extinction-opposing BLA output pathways, respectively26. After selectively labelling each population with the retrograde tracer cholera toxin B (CTB) (Extended Data Fig. 12j–m, see Methods), we recorded CTB+ (and neighbouring CTB−) BLA neurons while optically stimulating ITCvm or ITCdm. This revealed GABAergic (picrotoxin-sensitive) connections from ITCvm to PL-projecting BLA neurons and from ITCdm to IL-projectors, but not vice versa (Fig. 4f–h). Connections from ITCdm to IL-projecting BLA neurons were also stronger than those from ITCvm to BLA PL-projectors (Fig. 4i,j).
These data demonstrate a double dissociation in connectivity from specific ITC clusters to distinct amygdala output pathways. Fear-promoting BLA→PL and CeM→vlPAG pathways are more strongly inhibited by ITCvm than ITCdm, whereas ITCdm makes inhibitory inputs onto the extinction-promoting BLA→IL pathway (Extended Data Fig. 12n). mPFC-projecting BLA neurons preferentially contact IL and PL neurons that project back to BLA27, and these mPFC→BLA projections are differentially involved in fear extinction28. Thus, ITCdm and ITCvm clusters have specific and direct access to major cortico-amygdala loops regulating fear extinction.
Discussion
Brain mechanisms enabling an appropriate balance between avoiding threat-predicting stimuli and suppressing excessive defensive behaviour after uneventful encounters are critical to survival. Here, we show the ITC clusters located in the intermediate capsule boundary between BLA and CeA provide a substrate for achieving this balance during fear extinction. The relative weighting of ITC cluster activity also reflected exploration of protected and unprotected areas in the elevated zero-maze. Hence, dynamic changes in the balance of ITC activity may be a general feature of behavioural state shifts occurring during significant changes in the environment.
The ITCdm and ITCvm clusters form a mutually inhibitory network precisely accessing functionally distinct amygdala output pathways to orchestrate a broader circuitry underlying a switch in defensive states. Direct mutual inhibitory connections between ITC clusters offer an efficient mechanism subserving shifts in relative activity in response to experience with the CS, such that a weighting favouring ITCdm→ITCvm interactions during fear retrieval is dynamically transformed to ITCvm→ITCdm inhibition with extinction. This dynamic process may be modulated by, as yet unidentified, upstream regions conveying information to the ITCs about the sensory and valence properties of the CS and US. Though dissociable neuronal populations and subregions in other brain regions are known to exert opposite effects on extinction3–5, the ITCs appear unique in accommodating mutual inhibition as spatially separated inter-cluster connectivity.
A mutually inhibitory motif could amplify small differences in input to an all-or-none output pattern, providing a ‘winner-take-all’ mechanism enhancing signal-to-noise to generate robust ITC circuit-output and associated behavioural states29,30. Accordingly, ITCs could serve as a low-dimensional interpreter of sensory, cognitive and emotional information to orchestrate amygdala functions and associated brain states underpinning adaptation to salient environmental demands. ITC neurons could thereby influence a wide-range of amygdala-mediated behaviours, including states associated with positive valence, which have overlapping neural representations with fear extinction31–33. Finally, given ITCs are present in human brain34 aberrant ITC function could contribute to susceptibility to various psychiatric conditions.
Methods
Mice
All animal procedures were performed in accordance with institutional guidelines and with current European Union guidelines, and were approved by the Veterinary Department of the Canton of Basel-Stadt, Switzerland, by the local government authorities for Animal Care and Use (Regierungspräsidium Tübingen, State of Baden-Württemberg, Germany), and by the NIAAA Animal Care and Use Committee. FoxP2-IRES-Cre mice (JAX#030541)35 were used for Cre-dependent expression of viral vectors. For some experiments where a Cre-dependent expression system was not required, Arc-CreER mice36 crossed with a tdTomato reporter line (Ai14) were used in addition to wild-type C57BL/6J mice. For 3D reconstruction, FoxP2-IRES-Cre mice crossed with Ai14 and D1R-Cre (JAX#37156) mice crossed with Ai14 were used. All lines were backcrossed to C57BL/6J. For behavioural experiments, only male mice (aged 1.5–3 months old at the time of virus injection) were used. Both male and female mice (2–5 months old at the time of injection, unless otherwise noted) were used for virus-based circuit tracings, ex vivo electrophysiology and immunohistochemistry. These analyses indicated no discernible differences between males and females; however, more detailed studies will be needed to examine potential sex differences in ITC circuit anatomy and function. Mice were individually housed for at least two weeks before starting behavioural paradigms. Animals were kept in a 12-h light/dark cycle with access to food and water ad libitum. All behavioural experiments were conducted during the light cycle.
Surgical procedures and viral vector injections
Buprenorphine (Temgesic, Indivior UK Limited; 0.1 mg/kg BW) was injected subcutaneously 30 min prior to the surgery. Mice were anesthetized using isoflurane (5% for induction, 1–2% for maintenance; Attane, Provet) in oxygen-enriched air (Oxymat 3, Weinmann) and then head-fixed on a stereotactic frame (Model 1900, Kopf Instruments). Lidocaine + Ropivacain (Lidocain HCl, Bichsel, 10mg/kg BW; Naropin, AstraZeneca, 3mg/kg BW) were injected subcutaneously as local anesthesia prior to incision to the skin. Postoperative pain medication included buprenorphine (0.01 mg/ml in the drinking water; overnight) and injections of meloxicam (Metacam, Boehringer Ingelheim; 5 mg/kg subcutaneously) for up to three days if necessary. Eyes were protected with ophthalmic ointment (Viscotears, Alcon). Rectal body temperature of the animal was maintained at 35–37°C using a feedback-controlled heating pad (FHC) while fixed on the stereotactic frame.
Deep brain imaging:
AAV2/5.CaMK2.GCaMP6f37 (600 nl, University of Pennsylvania Vector Core, UPenn, for simultaneous imaging of CeA, ITCdm, and BLA) or AAV2/9.CAG.flex.GCaMP6f (200 nl, University of Pennsylvania Vector Core, UPenn, for ITCvm) was unilaterally injected into the amygdala using a precision micropositioner (Model 2650, Kopf Instruments) and pulled volume-calibrated glass capillaries (Drummond Scientific, Cat.-No. 2–000-001, tip diameter about 15 μm) connected to a Picospritzer III microinjection system (Parker Hannifin Corporation) at the following coordinates; For ITCdm: AP −1.4 mm (from bregma), ML −3.3 mm (from bregma), DV 4.4 mm (from pia); For ITCvm: AP −1.6 mm (from bregma), ML −3.1 mm (from bregma), DV 5.0 mm (from pia); After waiting at least 10 min for diffusion of the virus, a gradient-index microendoscope (ITCdm: φ1.0 × 9.0 mm, 1050–002179, Inscopix GRIN lens; ITCvm: φ0.6 × 7.3 mm, 1050–002177, Inscopix GRIN lens) was implanted. The larger diameter lens was used to record from ITCdm 1) to increase the probability of capturing this relatively small cluster in the field of view and 2) to provide simultaneous recordings from BLA and/or CeA neurons from the same lens. The smaller diameter lens was used to record from ITCvm to reduce damage to the overlying CeA. For dual-colour 2-photon imaging, a cocktail of AAV2/5.CaMK2.GCaMP6f and AAV2/1.CAG.FLEX.tdTomato (University of Pennsylvania Vector Core, UPenn) (600nl, 10–20:1 mixture ratio) was unilaterally injected targeting ITCdm. A sterile 21-gauge needle was used to make an incision above the imaging site to avoid excessive brain pressure. The GRIN lens was subsequently lowered into the brain with a micropositioner (coordinates; For ITCdm: AP −1.4 mm, ML 3.25 mm, DV 4.35 mm (from pia); For ITCvm: AP −1.6 mm, ML 3.0 mm, DV 4.8 mm (from pia)) using a custom-built lens holder and fixed to the skull using UV light-curable glue (Henkel, Loctite 4305). Surface of the skull was sealed with Vetbond (3M). Dental acrylic (Paladur, Heraeus) was used to further seal the skull and attach a custom-made titanium head bar for fixation during the miniature microscope mounting procedure. The implanted GRIN lens was protected by rapid-curing silicone elastomers.
Chemogenetic manipulation:
AAV2/8(the genome of serotype 2 packaged in the capsid from serotype 8).hSyn.KORD.IRES.mCitrine38 (Addgene plasmid # 65417, packaged by Virovek (Hayward, CA, USA)) or AAV2/8.hSyn.DIO.hM3D(Gq)-mCherry39 (Addgene viral prep # 44361-AAV8) was bilaterally injected to FoxP2-Cre experimental animals (Cre+) and Cre− control animals in a volume of 0.15 μL per hemisphere for individual clusters or 0.25 μL per hemisphere for both medial clusters with a 0.5 μL syringe (Neuros model 7001 KH, Hamilton Robotics, Reno, NV, USA) connected to a UMP3 UltraMicroPump and SYS-Micro4 Controller or Nanoliter NL2010MC4 injector (World Precision Instruments, LLC, Sarasota, FL, USA) at the following coordinates; for ITCdm targeting: AP −1.4 mm, ML ±2.95 mm, DV −4.55 mm (from bregma); for ITCvm targeting: AP −1.55 mm, ML ±2.75 mm, DV −5.15 mm; for dual ITCdm and ITCvm targeting: AP −1.43 mm, ML ±2.75 mm, DV −4.75 mm.
Virus-based circuit tracings:
AAV2/1.hSyn.flex.synaptophysin-EGFP (packaged by VectorBiolabs, 10–25nl) was target-injected into either ITCdm or ITCvm (with the same coordinates as shown above) of FoxP2-IRES-Cre mice. Following viral injections, pipettes were left in place for 10 min and retracted slowly to better restrict virus infection. Three to five weeks after the injection, the animals were sacrificed for histological analysis.
Ex vivo electrophysiology:
For KORD functionality assay (Extended Data Fig.7), AAV2/8.hSyn.KORD.IRES.mCitrine was injected targeting both medial ITC clusters in FoxP2-IRES-Cre mice as stated above. For inter-cluster connectivity assay (Fig. 4a–d, Extended Data Fig. 10), AAV2/1.EF1a.DIO.HChR2(H134R)-EYFP (U.Penn) was target-injected using a precision stereotactic frame (Model 1900, Kopf Instruments) into either ITCdm or ITCvm of FoxP2-IRES-Cre mice as noted above. For analysis of ITC-BLA connectivity (Fig. 4e–j), FoxP2-IRES-Cre mice were unilaterally injected into the amygdala with 500 nl of AAV2/9.hSyn.flex.soCoChR-EGFP40 (Addgene # 107712-AAV9) (coordinates: AP −1.5 mm, ML ±3.15 mm, DV 4.2–5.0 mm (from pia)) so that both ITCdm and ITCvm would be infected. Mice were allowed to recover for 5–6.5 weeks for KORD functionality assay (Extended Data Fig.7), and for 2–4 weeks before ex vivo electrophysiology experiments (Fig. 4, and Extended Data Fig. 10). To retrogradely label PL- or IL-projecting BLA neurons, 50 nl of 0.5% cholera toxin B conjugated to either Alexa Fluor 555 or 647 (CTB555 or CTB647) was injected into the same hemisphere of the mPFC as the AAV injection at the following coordinates (for PL targeting: AP +1.55 mm, ML ±0.3 mm, DV 1.9 mm (from pia); for IL targeting: AP +1.75 mm, ML ±0.4 mm, DV 2.5 mm (from pia)). To label vlPAG-projecting CeM neurons, 100 nl of 0.2 % CTB555 in PBS were injected into the same side of the vlPAG as the AAV injection. To avoid the subcranial midline blood sinus while targeting the vlPAG, a hole with a diameter of 0.3 mm was drilled into the skull at ±1.7 mm from midline suture, and at the level of the lambda suture. The injection capillary was then slowly lowered at a zenith angle of 26° to the target depth of 3 mm below brain surface. CTB injections and AAV injections were performed in the same surgeries.
Fibre photometry recordings:
ITCdm and ITCvm in the same hemisphere were targeted with 25 nl of AAV2/1.CAG.Flex.NES.jRGECO1a.WPRE41 (Addgene) and AAV2/1.CAG.Flex.jGCaMP7f.WPRE42, respectively, or AAV2/1.CAG.Flex.jGCaMP7f.WPRE was injected to target left ITCdm and right ITCvm. Following virus injections, an optical cannula comprised of a bare optical fibre (φ 0.4) and a fibre ferrule (Doric Lenses) was implanted in the BLA (AP −1.4 mm, ML ±3.3 mm, DV 4.3 mm (from pia)) for unilateral recordings. For bilateral recordings, ITCdm and ITCvm clusters were directly targeted by two optical cannulas with the same coordinates as virus injections. The surface of the skull was sealed with Vetbond (3M). Dental acrylic (Paladur, Heraeus) was used to further seal the skull and attach a custom-made titanium head bar for fixation. The ferrules were protected by rapid-curing silicone elastomers.
Immunohistochemistry
Mice were deeply anaesthetized with urethane (2 g/kg; intraperitoneally) and transcardially perfused with PBS followed by 4% paraformaldehyde (PFA) in PBS. Brains were post-fixed over night at 4°C and subsequently stored in PBS at 4°C. Coronal slices (120 μm) containing the BLA were cut with a vibratome (VT1000S, Leica). Sections were washed in PBS for 10 min two times, permeabilized with permeabilization solution43 (0.2% Triton X-100, 20% DMSO, and 23 g/L Glycine in PBS) for 30 min at 37°C, blocked in blocking solution (0.2% Triton X-100, 10% DMSO, and 6% normal donkey serum (NDS) in PBS) for 30 min at 37°C. Slices were subsequently incubated in primary antibody solution (1:2000 rabbit anti-FoxP2 (Abcam, ab16046), 5% DMSO, 3% NDS, 0.2% Triton X-100, 10 mg/L Heparin in PBS) for 24 h at 37°C. After washing for 10 min three times with 0.2% Triton X-100 in PBS, sections were incubated for 24 h at 37 °C with a secondary antibody solution (1:500 donkey anti-rabbit Alexa Fluor 647 (Thermo Fisher Scientific), 3% NDS, 0.2% Triton X-100, and 10 mg/L heparin in PBS. After washing at least 30 min three times in PBS, sections were mounted on gelatin-coated glass slides and covered with anti-fade mounting medium and coverslips. Sections were scanned using a laser scanning confocal microscope (LSM700, Carl Zeiss) equipped with a 5x air objective (Plan-Apochromat 5x/0.15NA), a 10x air objective (Plan-Apochromat 10x/0.45NA), 20x air objective (Plan-Apochromat 20x/0.8NA) or 63x oil objective (Plan-Apochromat 63x/1.4NA).
3D reconstruction
For 3D reconstruction, thick coronal sections (3–4 mm) containing all the ITC clusters were prepared with a vibratome (VT1000S, Leica). The sections were then cleared using the CUBIC protocol44. A subset of sections was also stained with the FoxP2 antibody. The cleared tissues were imaged with a confocal microscope (Zeiss, LSM700) equipped with a 10x air objective (Zeiss, C Epiplan-Apochromat 10x/0.40NA) or 20x air objective (Zeiss, LD Plan-NEOFLUAR, 20x/0.4NA), which have a relatively long working distance (> 5 mm). The voxel size was 1–3 um * 1–3 um * 10um (x*y*z) to achieve single-cell resolution. Acquired images were imported to Imaris software (Bitplane) and individual ITC clusters were manually reconstructed plane-by-plane with manual contour drawing function in ‘Measurement Pro’ package. Densely packed regions with marker positive neurons were regarded as clusters. Semi-transparent mouse brain scheme was created using Brainrender45.
Deep brain calcium imaging
Miniature microscope imaging:
Two to six weeks after GRIN lens implantation, mice were head-fixed to check for sufficient expression of GCaMP6 using a miniature microscope46 (nVista HD, Inscopix). Mice were briefly anesthetized with isoflurane to fix the microscope baseplate (1050–002192, Inscopix) to the skull using blue light curable glue (Vertise Flow, Kerr). The microscope was removed and the baseplate was capped with a baseplate cover (1050–002193, Inscopix). Mice were habituated to the brief head-fixation on a running wheel for miniature microscope mounting for at least three days before the behavioural paradigm. Imaging data were acquired using nVista HD software (Inscopix) at a frame rate of 20 Hz with an LED power of 10–60% (0.9–1.7 mW at the objective, 475 nm), analogue gain of 1, and with 1080 × 1080 pixels. For individual mice, the same imaging parameters were kept across days. Timestamps of imaging frames and behavioural stimuli were collected for alignment using the Omniplex system (Plexon).
Fear conditioning and extinction paradigm:
Two different contexts were used; Context A (extinction context) consisted of a clear cylindrical chamber (diameter: 23 cm) with a smooth floor, placed in a dark-walled sound attenuating chamber under dim light conditions. The chamber was scented and cleaned with 1% acetic acid. Context B (fear conditioning context) contained a clear square chamber (26.1 × 26.1 cm) with an electrical grid floor (Coulbourn Instruments) for footshock delivery, placed in a light-coloured sound attenuating chamber with bright light conditions, and was scented and cleaned with 70% ethanol. A stimulus isolator (ISO-Flex, A.M.P.I.) was used for the delivery of direct current (DC) shock. Both chambers contained overhead speakers for delivery of auditory stimuli, which were generated using a System 3 RP2.1 real time processor and SA1 stereo amplifier with RPvdsEx Software (all Tucker-Davis Technologies). Cameras (Stingray, Allied Vision) for tracking animal behaviour were also equipped in both chambers. Radiant Software (Plexon) was used to generate precise TTL pulses to control behavioural protocols and all the TTL signals including miniscope frame timings were recorded by Plex Control Software (Plexon) to synchronize behavioural protocols, behavioural tracking, and miniscope imaging.
On Day1 (Habituation), the mice were first imaged in their homecage for 10 min, and then placed in context A and exposed to 5 CSs (29 pips, 200 ms, 6-kHz pure tone, repeated at 1 Hz) following a 4-min baseline period. The ITI (inter tone interval) was 30 s. On Day2 (fear conditioning), mice were first imaged in their homecage for 10 min, and then fear conditioned in context B by pairing 5 CSs with an unconditioned stimulus (US; 1-s footshock, 0.65 mA DC; applied 800 ms after termination of the last (29th) pip) with a variable ITI of 60–90 s (after a 2-min baseline period). Animals remained in context B for 1 min after the last CS-US pairing. On Day3 and Day4 (extinction 1 and 2), fear memory was extinguished in context A. After a 4-min baseline period, animals were exposed to 25 CSs (ITI: 30 s). On Day5, extinction memory was assessed with 5 CS presentations (ITI: 30 s) following a 4-min baseline period.
Verification of implant sites (clearing-based, for ITCdm):
Upon completion of the behavioural paradigm, mice were lightly anesthetized with isoflurane, head-fixed and 3D-scanned with a 2-photon microscope (Ultima, Bruker) equipped with a Ti:Sapphire laser (Insight X3, Spectra Physics) and a 16x water objective lens (0.8NA, Nikon) or 25x water objective lens (1.05NA, Olympus), through the GRIN lens. After 2-photon microscopy, mice were transcardially perfused (as above). GRIN lenses and head bars were removed and brains were post-fixed in 4% paraformaldehyde overnight at 4°C. Horizontal thick sections (1.5–2.0 mm) containing the imaging site were cut with a vibratome (VT1000S). Sections were cleared and stained against FoxP2 using the CUBIC protocol44 and the same combination of antibodies as above, and then imaged with a confocal microscope (Zeiss, LSM700) equipped with a 5x air objective (Zeiss, Plan-Apochromat 5x/0.15NA) or 20x air objective (Zeiss, LD Plan-NEOFLUAR, 20x/0.4NA), which have a relatively long working distance. Using blood vessels and fibres as landmarks, a maximum intensity projection of the movie acquired with a miniature microscope, a 3D stack acquired with the 2-photon microscope, and a 3D stack acquired with confocal microscopy were manually matched, and then, the area of the miniature microscope movie corresponding to FoxP2-positive area between BLA and CeA in the confocal image were assigned as ITCdm. Mice with obvious misplacement of the GRIN lens and with no FoxP2 signal were excluded from the analysis. For cases in which CeA was imaged in the periphery of the FOV, only data from ITCdm and BLA were analysed.
Verification of implant sites (slice-based, for ITCvm):
Upon completion of the behavioural paradigm, mice were transcardially perfused (as above). GRIN lenses and head bars were removed, and brains were post-fixed in 4% paraformaldehyde overnight at 4°C. Coronal sections (120 μm) containing the imaging site were cut with a vibratome (VT1000S), immediately mounted on glass slides and coverslipped. To verify the GRIN lens position, sections were imaged with a confocal microscope as described above. Images were matched against a mouse brain atlas47. Mice with misplacement of the GRIN lens were excluded from the analysis.
2-photon calcium imaging:
In a subset of mice used for miniature microscope experiments, awake head-fixed 2-photon imaging sessions were performed through the same implanted GRIN lenses using a 2-photon microscope (Ultima Investigator, Bruker) equipped with a Ti:Sapphire femtosecond laser (InSightX3, SpectraPhysics) and a 16x/0.8NA objective (N16XLWD-PF, Nikon). GCaMP6f and tdTomato were excited at 920 nm, and signals were filtered with a 517–567 nm band-pass filter and a 573–613 nm band-pass filter, respectively. Care was taken to shield the microscope objective and the photomultipliers from stray light. Images were obtained using Prairie View software (Bruker). Square regions (approximately 800 μm × 800 μm) were imaged at 512 × 512 pixels at 30 Hz with the resonant-galvo mode. Several planes were acquired from each animal. Aversive shocks (1 s, 2.00 mA DC) were generated by a stimulus isolator (ISO-Flex, A.M.P.I.) and applied through a pair of electrodes located on the skin of the face. Timing of shock presentations were synchronized with image acquisition by TTLs generated by the Prairie View software.
Chemogenetic manipulations and behavioural testing
Ligand injections:
FoxP2-IRES-Cre mice and Cre-negative littermate controls were injected with a Cre-dependent AAV, as described above, and both groups were administered salvinorin B (SalB) or clozapine-N-oxide (CNO) to control for potential behavioural effects of the compounds per se. To activate KORD, mice were subcutaneously injected with 10 mg/kg SalB (catalogue # 11488; Cayman Chemical Company, Ann Arbor, MI, USA) 20 min before the behavioural testing. SalB was dissolved in DMSO at a 1 μl/g body weight injection volume using a 50 μl Hamilton Syringe (Hamilton Company, Reno, NV, USA). To activate hM3Dq, mice were injected intraperitoneally (i.p.) with 3 mg/kg CNO (catalogue # C0832–5MG; Sigma Aldrich) 30 min before the behavioural testing. CNO was dissolved in 10% DMSO in saline and injected at a volume of 10 μl/g body weight.
Fear conditioning and extinction paradigm:
Behavioural tests started at 3.5 to 6 weeks after virus delivery. We did not find systematic relationship between the period between surgery and the effects of KORD both in vivo and ex vivo. Prior to testing, each mouse was handled for 2 min per day for 6 days and habituated to subcutaneous (for KORD) or intraperitoneal (for CNO) saline injections for 3 days. Fear conditioning was conducted in a 30 × 25 × 25 cm operant chamber (Med Associates, Inc., Fairfax, VT USA) with metal walls and a metal rod floor. To provide an additional olfactory cue, the chamber was cleaned between subjects with a 79.5% water/19.5% ethanol/1% vanilla extract solution. Following a 3-min baseline period, 3 pairings (60–90 s ITI) of CS (30 s, 80-dB white noise) and US (2 s 0.6 mA, co-terminating with the CS) were presented, followed by a 120-s stimulus-free period. The Med Associates Freeze Monitor system controlled CS and US presentation. Extinction training was conducted the following day (Day2) in a 27 × 27 × 14 cm operant chamber with transparent walls and a floor covered with wood chips, cleaned between subjects with a 99% water/1% acetic acid solution and housed in a different room from training. After a 3 min baseline period, either 50 (‘full extinction’) or 10 (‘partial extinction’) CSs were presented (5 s ITI)48. Extinction memory retrieval was tested the next day (Day3) in the same context as extinction training with 5 CS presentations (5 s inter-CS interval), following a 3-min baseline period.
Post-behaviour examination of virus expression:
To examine virus expression at the completion of behavioural tests, mice were terminally overdosed with pentobarbital and transcardially perfused with PBS followed by 4% PFA in PBS. Brains were post-fixed over night at 4°C and subsequently stored in 0.1 M phosphate buffer for 1–2 days at 4°C. Coronal sections (50 μm) were cut with a vibratome (Classic 1000 model, Vibratome, Bannockburn, IL, USA). Brain sections were incubated in 1% sodium borohydride followed by blocking solution (10% normal goat serum (Vector Laboratories) and 2% bovine serum albumin (MP Biomedicals, Santa Ana, CA, USA) in 0.05 M PBS with 0.2% Triton X-100) for 2 h at room temperature (20°C), then incubated at 4°C overnight in a cocktail of primary antibodies: 1) chicken anti-GFP (1:2000 dilution, Abcam cat#13970) to aid visualization of KORD, 2) Living Colors® DsRed Polyclonal Antibody (1:1000 dilution, Clontech Labs cat# 632496) to aid visualization of hM3Dq, and 3) rabbit anti-FoxP2 (1:2000 dilution, Abcam cat#16046) to visualize ITC. The next day, sections were incubated in a cocktail of secondary antibodies: Alexa 488 goat anti-chicken IgG (1:1000 dilution, Abcam cat#150169) and goat anti-rabbit Alexa 555 IgG (1:1000 dilution, Abcam cat# A21428). Sections were mounted and coverslipped with Vectashield HardSet mounting medium with DAPI (Vector Laboratories, Inc., Burlingame, CA, USA). Sections were imaged with an Olympus BX41 microscope (Olympus, Center Valley, PA, USA) and a Zeiss LSM 700 confocal microscope (Carl Zeiss Microscopy, Thornwood, NY, USA).
Images from the 139 Cre+ injected mice were inspected to determine whether virus expression was evident and restricted to the ITC cluster targeted and if so, whether expression was present in one or both hemispheres. Targeting success rates (rounded to the nearest %) were as follows: ITCvm-targeting: 41% (21% bilateral, 20% unilateral); ITCdm-targeting: 35% (17% bilateral, 17% unilateral), dual-cluster targeting: 42% (23% bilateral, 19% unilateral). Mice with absent expression were excluded from the analysis. Mice with unilateral or bilateral expression were combined given analysis of freezing behaviour on retrieval indicated generally similar results (Supplementary Table 2).
To illustrate expression patterns, virus expression in each mouse was overlayed to a corresponding coronal atlas image47 and expression within each binned 35 μm * 40 μm segment transformed to a numerical value (expression present =1, absent = 0). Images were then aggregated across mice included in the final behavioural analysis (separately for ITCvm-targeted, ITCdm-targeted and dual-cluster targeted) to generate a population heatmap of expression indicating the fraction of animals exhibiting expression at each binned segment (0: no mice expressed; 1: all mice expressed) (see Extended Data Fig. 8 and 9).
Ex vivo electrophysiology
KORD functionality verification and connectivity assays between ITCs:
Mice were deeply anaesthetized with 3% isoflurane in oxygen and decapitated. The brain was rapidly extracted and cooled down in ice-cold slicing artificial cerebrospinal fluid (ACSF) containing (in mM): 124 NaCl, 2.7 KCl, 26 NaH2CO3, 1.25 NaH2PO4, 10 MgSO4, 2 CaCl2, 18 D-Glucose, 4 ascorbic acid, equilibrated with carbogen (95% O2 / 5% CO2). Coronal brain slices (320 μm) containing the amygdala were cut in ice-cold slicing ACSF with a sapphire blade (Delaware Diamond Knives) on a vibrating microtome (Microm HM 650 V, Thermo Scientific). Slices were collected in a custom-built interface chamber with recording ACSF containing (in mM): 124 NaCl, 2.7 KCl, 26 NaH2CO3, 1.25 NaH2PO4, 1.3 MgSO4, 2 CaCl2, 18 D-Glucose, 4 ascorbic acid, equilibrated with carbogen. Slices were recovered at 37°C for 40 min and stored at room temperature. Whole-cell patch-clamp recordings were performed in a submersion chamber under an upright microscope (Olympus BX51WI), where slices were superfused with recording ACSF at 31°C. Recordings were performed using an Axon Instruments Multiclamp 700B amplifier and a Digidata 1440A digitizer (Molecular Devices). Glass micropipettes (6–8 MΩ resistance) were pulled from borosilicate capillaries (ID 0.86 mm, OD 1.5 mm, Science Products, Germany).
For KORD functionality verification the resting membrane potential and spikes were recorded in current-clamp mode with K-Gluconate based internal solution containing (in mM): 130 K-Gluconate, 5 KCl, 4 Mg-ATP, 0.4 Na-GTP, 10 Na2-phosphocreatine, 10 HEPES, 0.6 EGTA (290–295 mOsm, pH 7.2–7.3). Signals were low-pass filtered at 10 kHz and digitized at 20 kHz. Salvinorin B (Tocris Bioscience) was prepared as 1mM stock solution in DMSO, diluted to 100nM in ACSF on the day of recording, and perfused via the bath. Data from ITCdm and ITCvm cells were pooled for analysis.
For connectivity assays between ITC clusters, post synaptic currents were recorded in voltage-clamp configuration with cesium-based internal solution containing (in mM): 115 Cs-methanesulphonate, 20 CsCl, 4 Mg-ATP, 0.4 Na-GTP, 10 Na2-phosphocreatine, 10 HEPES, 0.6 EGTA (290–295 mOsm, pH 7.2–7.3). Signals were low-pass filtered at 2 kHz (4-pole Bessel) and digitized at 10 kHz. Series resistance was monitored and data rejected if it changed > 25% over the course of an experiment. ChR2 was stimulated with 470 nm light pulses (0.5–1 ms duration) delivered by an LED (CoolLED pE) through the microscope’s submersion objective (Olympus LUMPlanFL 60x, 1.0 NA). By restricting the light path aperture, illumination was confined to a small spot within the slice (80 μm diameter). Drugs were prepared from frozen stocks, diluted in ACSF and applied via superfusion for pharmacological experiments. Picrotoxin (PTX, 100 μM, Sigma, Germany) was used to block GABAergic transmission, tetrodotoxin (TTX, 1 μM, Biotrend, Germany) was first applied alone, and subsequently together with 4-aminopyridine (4-AP, 100 μM, Tocris Bioscience) to assess monosynapticity of evoked postsynaptic currents49. In most experiments with on-cluster stimulation, 20 μM DNQX (Biotrend, Germany) was added to the recording ACSF to block fast glutamatergic transmission.
Connectivity assays from ITCs to BLA:
Mice were deeply anaesthetized (ketamine 250 mg/kg and medetomidine 2.5 mg/kg bodyweight, injected intraperitoneally) and transcardially perfused with ice-cold (0–2°C) NMDG-based solution50,51 (in mM: 2.5 KCl, 1.25 NaH2PO4 (1 H2O), 10 MgSO4 (7 H2O), 0.5 CaCl2 (2 H2O), 30 NaHCO3, 20 HEPES, 25 Glucose, 93 NMDG,5 Sodium Ascorbate, 2 Thiourea, 3 Sodium Pyruvate, 93 HCl, oxygenated with 95% O2/5% CO2, pH 7.3–4) for 3 min. The brain was rapidly removed from the skull, and coronal brain slices (300 μm) containing ITCs and BLA were prepared in ice-cold NMDG-based solution with a vibrating-blade microtome (HM650V, Microm) equipped with a sapphire blade (Delaware Diamond Knives). For recovery, slices were kept in the dark for 10 min at 33°C in an interface chamber containing the NMDG-based solution and afterwards at room temperature (20–24°C) in Hepes-holding solution (in mM: 20 HEPES, 92 NaCl, 2.5 KCl, 1.25 NaH2PO4 (1 H2O), 2 MgSO4 (7 H2O), 2 CaCl2 (2 H2O), 25 Glucose, 30 NaHCO3, 5 Sodium Ascorbate, 2 Thiourea, 3 Sodium Pyruvate, oxygenated with 95% O2/5% CO2, pH 7.4) for at least 1 h until recording.
Experiments were performed in a submerged chamber on an upright microscope (BX50WI, Olympus) superfused with oxygenated recording ACSF (in mM: 123 NaCl, 3 KCl, 1.25 NaH2PO4 (1 H2O), 1 MgCl2 (6 H2O), 2 CaCl2 (2 H2O), 11 Glucose, 26 NaHCO3, 10 μM CNQX and 10 μM CPP) at a perfusion rate of 4 ml/min at 32°C. EGFP+ ITC clusters and CTB+ BLA projection neurons were visualized using epifluorescence and a 5x air immersion objective(LMPlanFI 5x/0.15 NA, Olympus) or a 40x water immersion objective (LumPlanFl 40x/0.8 NA, Olympus). Patch electrodes (for BLA, 3–5 MΩ; for ITCs, 7–8 MΩ;) were pulled from borosilicate glass tubing and filled with internal solution (for voltage-clamp recordings in mM: 110 CsCl, 30 K-gluconate, 1.1 EGTA, 10 HEPES, 0.1 CaCl2, 4 Mg-ATP, 0.3 Na-GTP, 4 QX-314 chloride, pH 7.3; for current-clamp recordings in mM: 130 K-methylsulfate, 10 HEPES, 10 Na-phosphocreatine, 4 Mg-ATP, 0.3 Na-GTP, 5 KCl, 0.6 EGTA, pH 7.3). In some experiments, 0.4% biocytin was added to post-hoc visualize recorded neurons. Voltage-clamp recordings from BLA neurons were acquired in whole-cell mode at a holding potential of −70 mV. soCoChR expressing ITCdm and ITCvm were photostimulated using blue LEDs (PlexBright Blue, 465 nm, with LED-driver LD-1, Plexon) connected to optical fibres (0.39NA, FT200EMT, Thorlabs) positioned above them. Five blue light pulses of 0.6 mW (at the fibre-tip) with 10-ms duration were applied at a frequency of 0.5 Hz. Inhibitory postsynaptic currents were averaged across at least 10 light pulses. In some slices, PTX (100 μM) was administered with the recording ACSF for the last cell recorded from. In current-clamp recordings from ITCs, spikes were evoked from a holding potential of about −70 mV with the same blue light stimulation protocol as above. Data was acquired with a Multiclamp 700B amplifier, Digidata 1440A A/D converter and pClamp 10 software (all Molecular Devices) at 20 kHz and filtered at 10 kHz. Data were excluded if the access resistance exceeded 25 MΩ or 10% of the membrane resistance or changed more than 20% during the recordings. All chemicals were purchased from Sigma-Aldrich except for CNQX, CPP and QX-314 (Tocris Bioscience).
Post-hoc histological analysis for connectivity assays between ITCs:
Following recordings, slices were sandwiched between two cellulose nitrate filter papers (0.45 μm pore size, Sartorius, Germany) and fixed in 4% PFA in 0.1 M phosphate buffered saline (PBS, pH 7.4) overnight. To confirm cluster-specific ChR2-EYFP expression, fixed slices were re-sectioned at 60 μm thickness with a vibrating microtome (Microm HM 650 V, Thermo Scientific). Free floating sections were incubated in blocking solution (20% horse serum, 0.03% Triton X-100 in PBS) for 2 h at room temperature, and then overnight in PBS with 10% blocking solution and primary antibodies at a 1:1000 dilution; in all cases against EYFP fused to channelrhodopsin2 (Goat- anti-GFP polyclonal), in some batches also against FoxP2 (Rabbit- anti-FoxP2 polyclonal). On the next day, sections were washed 3 times for 10 min in PBS, and incubated for 2 h at room temperature in PBS with 10% blocking solution and secondary antibodies at 1:1000 dilution; in all cases with Donkey-anti-goat-Alexa488, for FoxP2 staining additionally with Donkey-anti-rabbit-Alexa555. Slices were then washed 3 times for 10 minutes in PBS, incubated for 25 min in 1:500 Neurotrace 435/455 in PBS, and washed 3 more times for 10 minutes in PBS. Sections were then mounted on glass slides in mounting medium (Vectashield, Vector Laboratories) and imaged with a confocal microscope (LSM 710, Zeiss).
Fibre photometry recording
A modified Doric Fibre Photometry system was used to perform the recordings. Three different excitation wavelengths were used (465 nm for Ca2+-dependent jGCaMP7f activity, 560 nm for Ca2+-dependent jRGECO1a activity, and 405 nm to record an isosbestic, Ca2+-independent, reference signal that serves to correct for photo-bleaching and movement-related artifacts52. The light intensity used for each wavelength was < 100 μW at the fibre tip. Optical patch cables were extensively photo-bleached before recordings to reduce auto-fluorescence and a lock-in modulation/demodulation procedure was used to improve the signal-to-noise ratio and spectral separation of the fluorescent signals53. Data were digitized and recorded at 20 kHz.
Elevated zero-maze paradigm:
The elevated zero-maze with a 55 diameter and a 5 cm width corridor was composed of two open and two closed quadrants, which are equivalent to 90° each, elevated at 50 cm above the ground. Two external walls and two internal walls with 15 cm height for the closed quadrants were made of opaque plastic and transparent plexiglass, respectively. Mice were allowed to freely explore the maze for 15 min. Mouse behaviours were video recorded with a camera controlled with a custom written code in Bonsai54, while synchronized with photometry recording via TTL pulses. The videos were post-hoc analysed by a second custom written code in Bonsai and the position of the mouse in the open versus closed quadrants determined as the central position of the body mass.
Quantification and statistical analysis
Analysis of behaviour during calcium imaging:
All behavioural sessions were recorded using an overhead camera (Stingray, Allied Vision) and Cineplex software (Plexon) at 40 Hz. Mice were tracked using contour tracking, and freezing behaviour was automatically scored with the assistance of a frame-by-frame analysis of pixel change (Cineplex Editor, Plexon). Freezing behaviour minimum duration threshold was set to 2 s. Automatically detected freezing epochs were manually inspected on the video recording to eliminate false-positive and false-negative freezing bouts (e.g., during micro-grooming episodes or due to motion artefacts caused by cable movement, respectively). Annotated freezing data were then temporally aligned with miniscope imaged data and finally downsampled to 10 Hz.
Analysis of behaviour for chemogenetic manipulation:
Behavioural sessions were video recorded with The Med Associates Freeze Monitor system (fear conditioning) or with GoPro HERO7 video camera (extinction training and retrieval). Based on the recorded videos, freezing was manually scored at 5 s intervals throughout testing by an experienced observer blind to genotype. The mean numbers of freezing observations per baseline period and 5x CS blocks were converted to a percentage [(number of freezing observations/total number of observations per period) × 100] for analysis. Mice with freezing scores on any CS-block >3 standard deviations from the group mean were excluded from the analysis.
Analysis of miniature microscope calcium imaging data:
Imaging frames were down-sampled to 540 × 540 pixels at 10 Hz and normalized across the whole frame by dividing each frame by a Fast Fourier Transform band pass-filtered version of the frame using ImageJ (NIH)19. Motion artifact correction and PCA/ICA-based cell detection was performed with MosaicAPI (Inscopix) for MATLAB. Edges of cell masks were then smoothed by open/close functions. Raw calcium traces were obtained by averaging all the pixel values in each mask. Slow drift of the baseline signal over the course of minutes was removed using a low-cut filter (Gaussian, cutoff, 2 – 4 min). Relative changes in calcium fluorescence F were calculated by ΔF/F0 = (F – F0)/F0 (with F0 = median fluorescence of entire trace). When a cell pair showed (1) distance between centroids < 15 pixels (2) correlation coefficient between entire time courses > 0.6, one of the pair was manually eliminated to avoid double-counting. Finally, pairs of the mask and the trace of all the cells were manually inspected to exclude false-positive/negative cell mask allocation. For fear extinction, images from consecutive 5 days were concatenated before the motion correction procedure. When there was major displacement of the field of view (FOV) and same set of neurons were not able to be identified across days, animals were excluded.
To define responsive cells, trial-averaged Ca2+ signals were compared between the stimulus and a temporally equivalent baseline period using a Wilcoxon rank-sum test with a significance threshold of P < 0.05. The windows for averaging were 2 s (shock), 4 s (CS-offset), and 29 s (CS), from stimulus-onset. AUC (area under the curve) ΔF/F values were calculated using these same windows. A cell was classified as a fear neuron if it exhibited a significant tone response after fear conditioning (CS 1–5 during Ext1 (Day3), when freezing levels were highest), but no significant response after extinction (CS 21–25 during Ext2 (Day4), when freezing levels were lowest), and vice versa for extinction neurons. Finally, units were classified as extinction-resistant neurons if they displayed a significant tone response during both time points23,55,56.
Analysis of 2-photon calcium imaging data:
The images were analysed by using custom written in-house software running on MATLAB (Mathworks). First, acquired images were motion corrected with NoRMCorre57. Artifacts caused by bi-directional scanning were corrected by shifting odd lines and even lines. Cell outlines were manually identified using ROI-manager function in ImageJ, based on motion corrected movies and maximum intensity projections. Time courses of individual cells were extracted by summing the pixel values within the cell outlines. Slow drift of the baseline signal over the course of minutes was removed using a low-cut filter (Gaussian, cutoff, 2–4 min). Raw calcium signal time courses were corrected to minimize out-of-focus signal contamination: neuropil signals were subtracted from cell body signals after multiplying by a fixed contamination ratio: 0.7 as previously described58,59.
Analysis of fibre photometry recordings:
Analysis was performed with custom programs written in MATLAB (Mathworks). Data with obvious motion artifacts in the isosbestic channel were discarded. Demodulated raw Ca2+ traces were down-sampled to 1 kHz and then de-trended using a low-cut filter (Gaussian, cutoff, 2–4 min) to correct for slow drift of the baseline signal due to bleaching. Filtered traces were Z-scored by mean and standard error of the entire trace.
Analysis of slice whole-cell recordings:
Data were analysed with custom written codes in Python 3.7 (Anaconda distribution) running the pyABF module, custom written Macros in IgorPro (Wavemetrics, USA), or custom programs written in MATLAB (Mathworks) using abfload (Harald Hentschke/Forrest Collman) function. Connectivity was defined by comparing signal vs baseline (10 trials), while statistical significance was assessed by Wilcoxon signed-rank test.
Statistical analyses and data presentation
All data are expressed as the mean ± standard error of the mean (SEM), unless stated otherwise. Box plots represent the median and 25th and 75th percentiles, and their whiskers represent the data range. In some of the plots, outlier values are not shown for clarity of presentation, but all data points and animals were always included in the statistical analysis. Two-sided Wilcoxon rank-sum test was used to compare two independent groups. For paired comparison, we used Wilcoxon signed-rank test or paired t-test based on distribution and n size of the data. An ANOVA was performed when more than two groups were compared, which was followed by Tukey-Kramer post-hoc method. For multiple comparisons against a baseline, Dunnett’s test was used. For comparing 2 distributions, Kolmogorov Smirnov test was applied. For trend, Jonckheere-Terpstra test was used. For categorical data, Chi-squared test or Fisher’s exact test (when sample sizes and expected frequencies are small) was applied. For repeated observations of freezing scores, a repeated measures ANOVA was used, which was followed by Sidak post-hoc method. All data analyzed by ANOVA were normally distributed according to a Kolmogorov-Smirnov test on the ANOVA residuals. Throughout the study, P < 0.05 was considered statistically significant. No statistical methods were used to pre-determine sample sizes, but our sample sizes are similar to those generally employed in the field.
Data availability
The data that support the findings of this study are available at: https://data.fmi.ch/PublicationSupplementRepo/
Code availability
Custom-written codes used to analyse data from this study are available upon reasonable request from the corresponding authors.
Extended Data
Extended Data Fig. 1 |. 3D-reconstruction of individual ITC clusters.
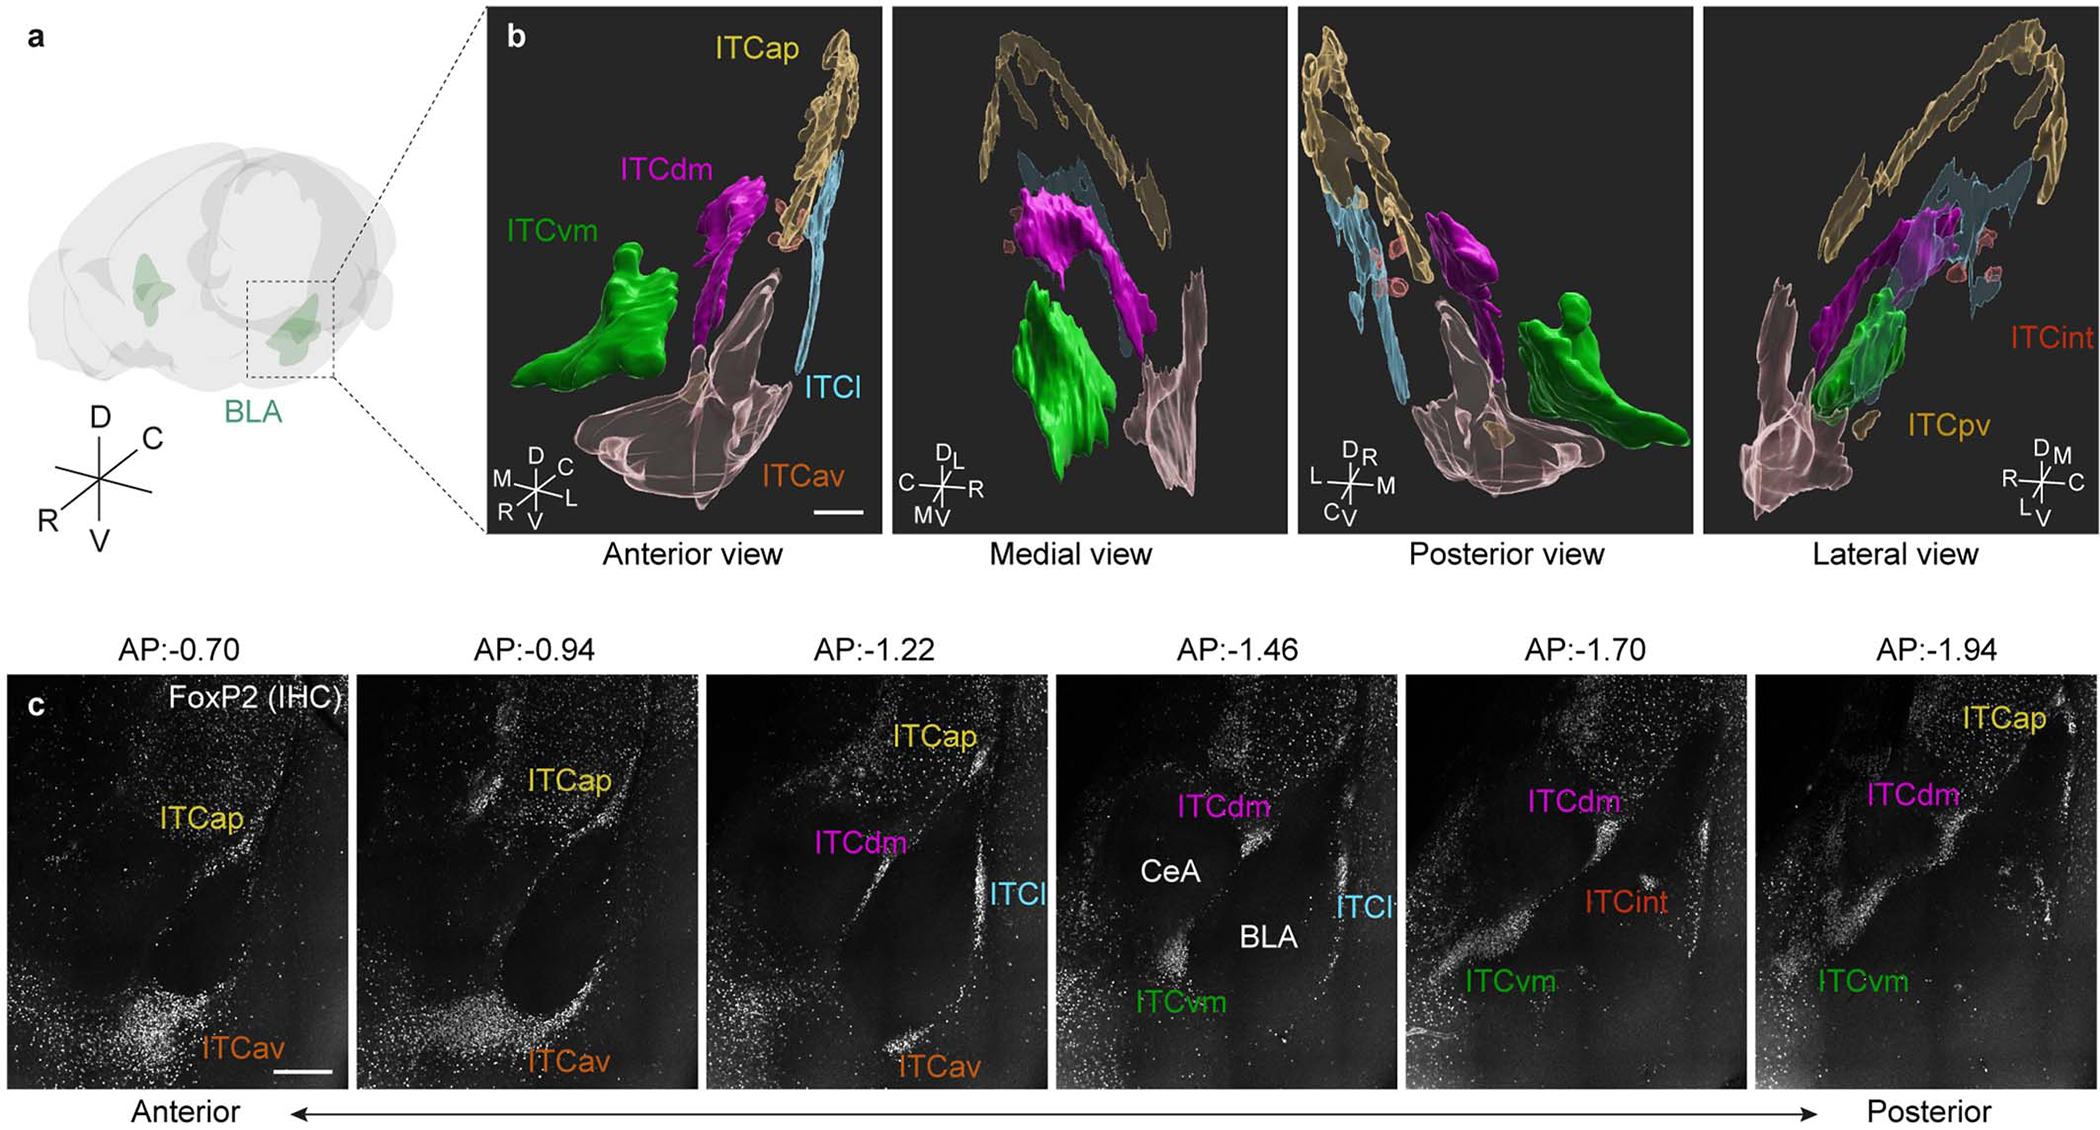
a, Schematic of a mouse brain volume. R: Rostral; C: Caudal; D: Dorsal; V: Ventral.
b, 3D reconstructions were separately obtained via 1) anti-FoxP2 immunostaining, 2) a FoxP2-Cre x Ai14 mouse, and 3) D1R-Cre x Ai14 mouse, in triplicate for each method. ITCap: apical; ITCdm: dorsomedial; ITCvm: ventromedial; ITCl: lateral; ITCav: anteroventral; ITCint: internal; ITCpv: posteroventral R: Rostral; C: Caudal; D: Dorsal; V: Ventral; M: Medial; L: Lateral; Scale bar: 300 μm.
c, Example planes of a cleared 3D-tissue obtained from a WT mouse stained with an anti-FoxP2 antibody covering the anterior-posterior axis of ITC clusters. Bregma levels are indicated above each panel. Scale bar: 300 μm.
See also Supplementary Movie 1 and Table 1.
Extended Data Fig. 2 |. Ca2+ imaging from ITCdm and ITCvm.
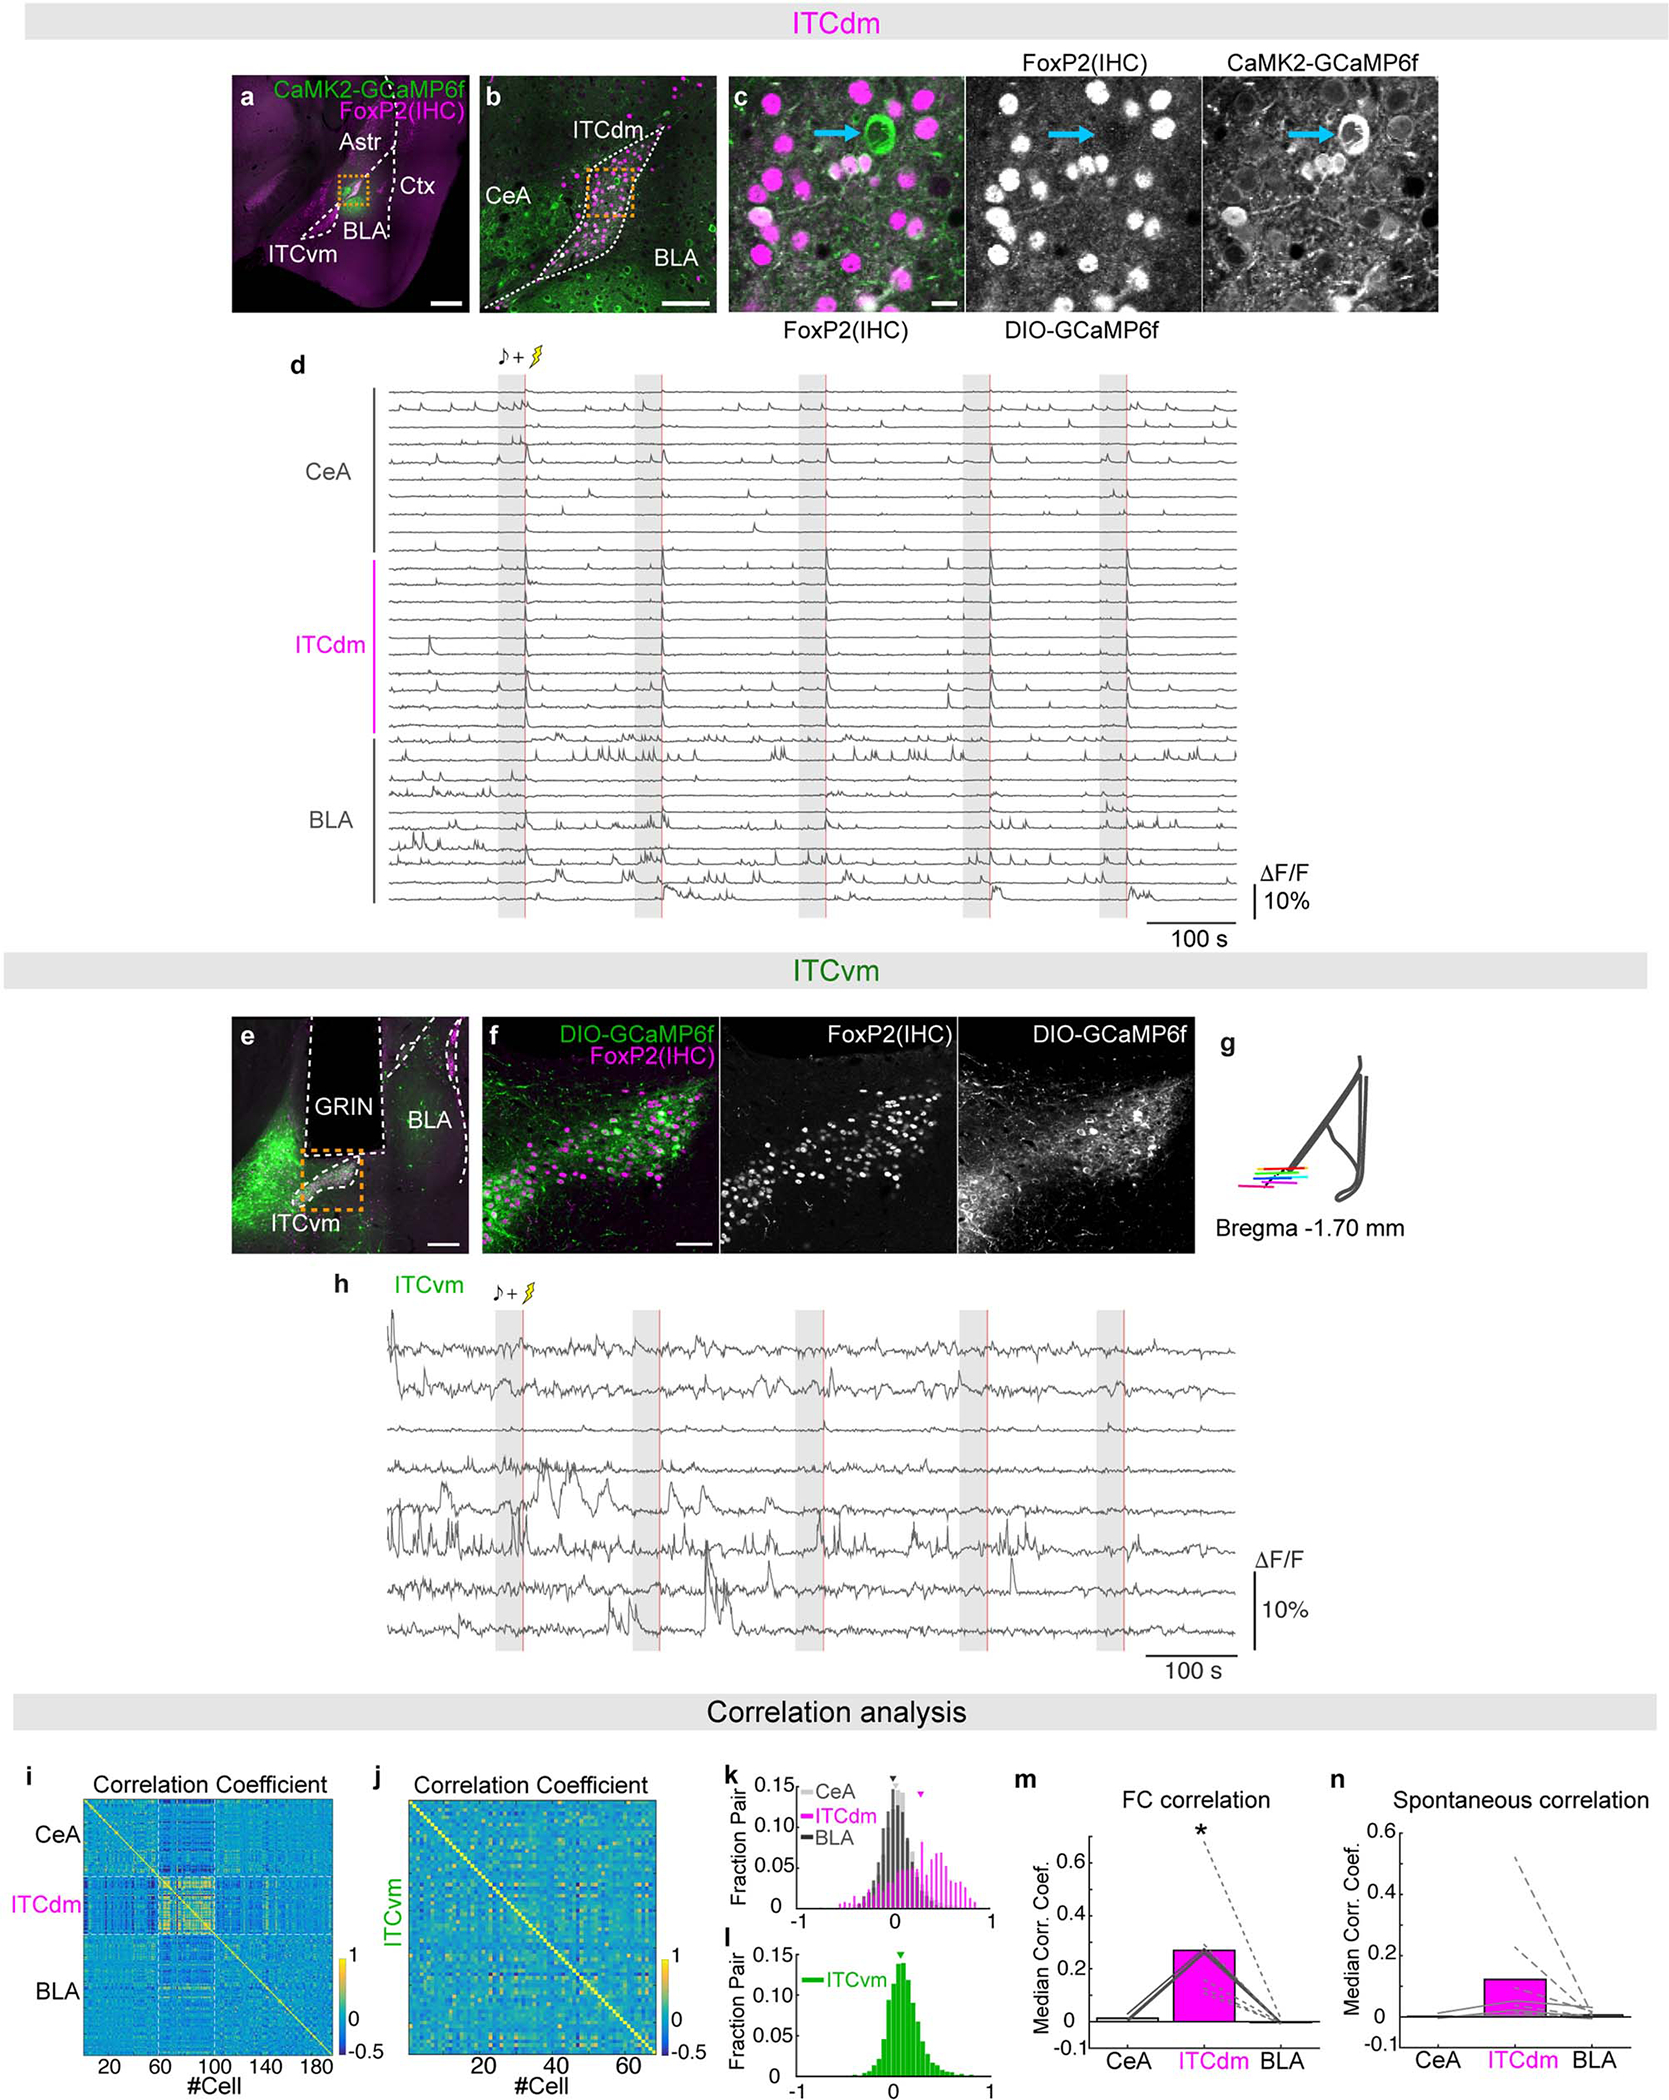
a-c, Histological validation of GCaMP6f expression. Wild-type mice (not used for in vivo imaging) (N = 2) were injected with an AAV-CaMK2-GCaMP6f and sacrificed after 1 month of expression. Thin slices (120 μm) were cut and stained with an anti-FoxP2 antibody. In addition to BLA and CeA neurons, most of the FoxP2-positive ITCdm neurons expressed GCaMP6f. Blue arrow shows a putative large, FoxP2-negative ITC neuron. Scale bars: 500 μm (a), 100 μm (b), and 10 μm (c).
d, Example Ca2+ traces from simultaneously imaged neurons in the CeA, ITCdm, and BLA with a miniature microscope during fear conditioning. Data obtained from the same mice as shown in Fig. 1d–g. Gray shading indicates CS presentation (30 s); red line indicates footshock US presentations (1 s).
e,f, Histological validation of GCaMP6f expression in ITCvm neurons. FoxP2-Cre mice were injected with an AAV encoding Cre-dependent GCaMP6f, implanted with a GRIN lens, and sacrificed after behavioural experiments. Thin slices (120 μm) were cut and stained with an anti-FoxP2 antibody. Scale bars: 200 μm (e), 50 μm (f). Similar results were obtained with all the six mice.
g, Summary of histologically confirmed GRIN lens implantation locations for ITCvm recordings. Animals with off-target implantations were excluded from analysis.
h, Example Ca2+ traces from neurons in the ITCvm cluster during fear conditioning. Gray shading indicates CS presentation (30 s); red line indicates footshock US presentations (1s). Images of GCaMP6f expression from the same mouse are shown in panel e,f.
i,j, Correlation matrices of all simultaneously-recorded neuron pairs in CeA, ITCdm, and BLA (i), or in ITCvm (j) from representative animals. The entire recording session (11 min) was used.
k, Distributions of correlation coefficients from CeA/CeA, ITCdm/ITCdm, and BLA/BLA pairs. Arrows indicate median of the distributions.
l, Distribution of correlation coefficients from ITCvm/ITCvm pairs. Arrow indicates median of the distribution.
m, Summary of medians of correlation coefficient distribution shown in (k). Solid lines indicate individual animals in which CeA, the ITCdm cluster, and BLA were simultaneously imaged (N = 3). Dotted lines indicate animals in which only the ITCdm cluster and BLA were simultaneously imaged (N = 5). * P = 0.007, one-way ANOVA followed by Tukey-Kramer.
n, Medians of correlation coefficient distribution. The same analysis as (m) was applied to data from home-cage recording sessions. ITCdm neurons also shows a trend towards a higher correlation in the absence of CS or US stimulation. * P = 0.12, one-way ANOVA.
Extended Data Fig. 3 |. 2-photon imaging and fibre photometry.
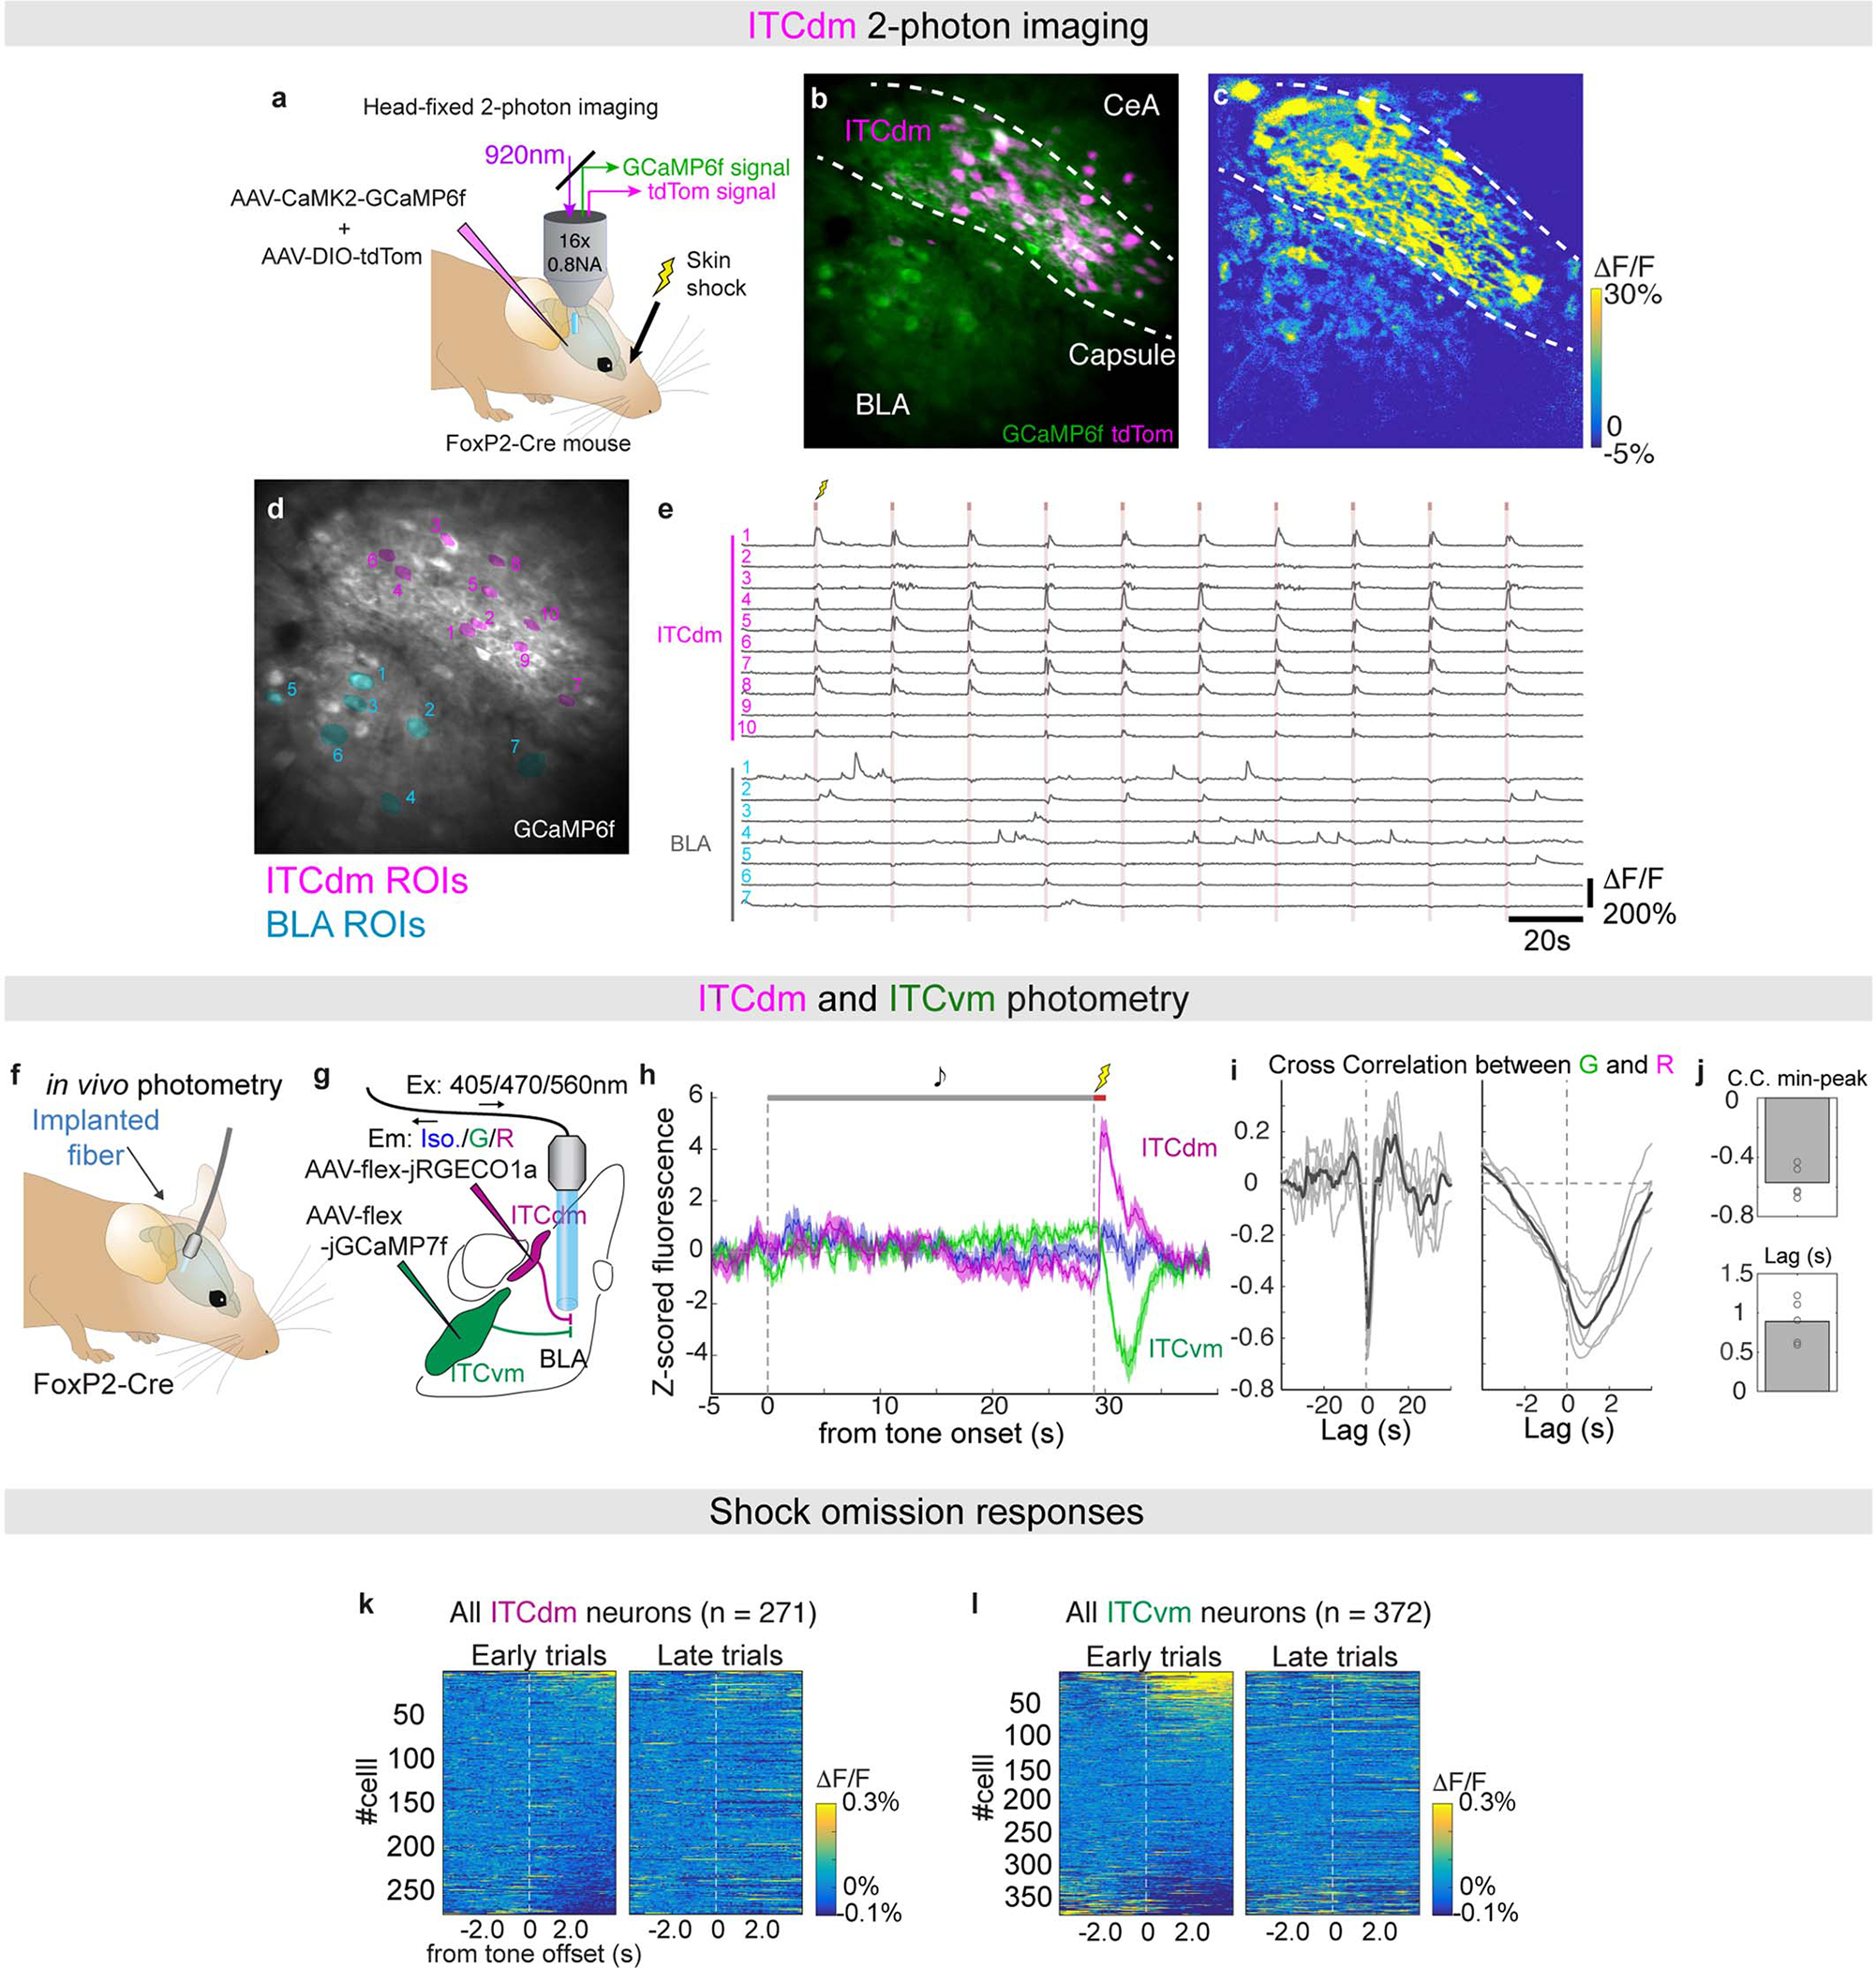
a, Schematic showing dual-colour in vivo 2-photon imaging through the implanted GRIN lens. ITCdm neurons were labelled by co-injection of an AAV expressing Cre-dependent tdTomato in FoxP2-Cre mice. A GRIN lens was implanted above ITCdm and surrounding BLA and CeA to record Ca2+ responses to aversive skin shocks (USs).
b, Mean projected FOV. Green: GCaMP6; Magenta: tdTomato. The dashed lines indicate the intermediate capsule surrounding ITCdm.
c, Heatplot of Ca2+ responses (ΔF/F) to US presentations showing clustered activation of ITCdm neurons.
d, ROIs corresponding to ITCdm (Magenta) and BLA (Blue) neurons. ROI numbers correspond to traces shown in e.
e, Example Ca2+ traces from ITCdm and BLA neurons. Red lines indicate US presentations (1 s). Note, we confirmed that face skin shock used in this experiment and footshock similarly activated ITCdm neurons (data not shown).
f, Schematic illustrating in vivo fibre photometry in a freely-moving mouse.
g, ITCdm and ITCvm clusters were targeted with AAVs encoding Cre-dependent jRGECO1a or jGCaMP7f, respectively. Recording fibres were placed in BLA to simultaneously monitor axon terminal Ca2+ dynamics of ITCdm and ITCvm axons. Isosbestic control signals were recorded in the blue channel.
h, Example traces of simultaneously recorded dual-colour Ca2+ signals and a control signal during a fear conditioning session.
i, Cross correlation traces between two simultaneously recorded Ca2+ signals. Dark gray lines represent 5-trial averaged traces and light gray lines represent individual trials.
j, (Top) Minimum peak values of cross correlation. (Bottom) Lags of the minimum peak points. (N = 2 mice)
k,l, Activity heatplot of trial-averaged responses (Left: first 5 trials, Right: last 5 trials) to footshock US omissions of all the recorded ITCdm (n = 271 neurons, from 9 mice) (k) or ITCvm neurons (n = 372 neurons, from 6 mice) (l) aligned by CS offset. Cells were sorted based on their averaged ΔF/F responses in the first 5 trials.
Extended Data Fig. 4 |. Population activity of ITCdm and ITCvm neurons.
a,b, Heatplots of all recorded neurons. (a) 271 ITCdm neurons from 9 mice and (b) 372 ITCvm neurons from 6 mice throughout the entire 5-day fear conditioning/extinction paradigm. Neurons were sorted by their classification into Fear, Extinction, Extinction Resistant, and non-Responsive neurons.
c, Example Ca2+ traces of a Fear and Extinction neuron from ITCdm and ITCvm, respectively for all time points indicate shown in panels (a,b). Habituation, Ext1: 1–5, Ext2: 21–25, and Retrieval time points are duplicated in Fig. 2c.
d, Scatter plots visualising distributions of tone responses of all the recorded ITCdm neurons (Left) and ITCvm neurons (Middle and Right) during Ext1: 1–5 and Ext 2: 21–25 trials. Functional cell-types – Fear, Extinction, and Extinction Resistant neurons – are plotted with different colours, non-responsive neurons in grey (c.f. Fig. 2d).
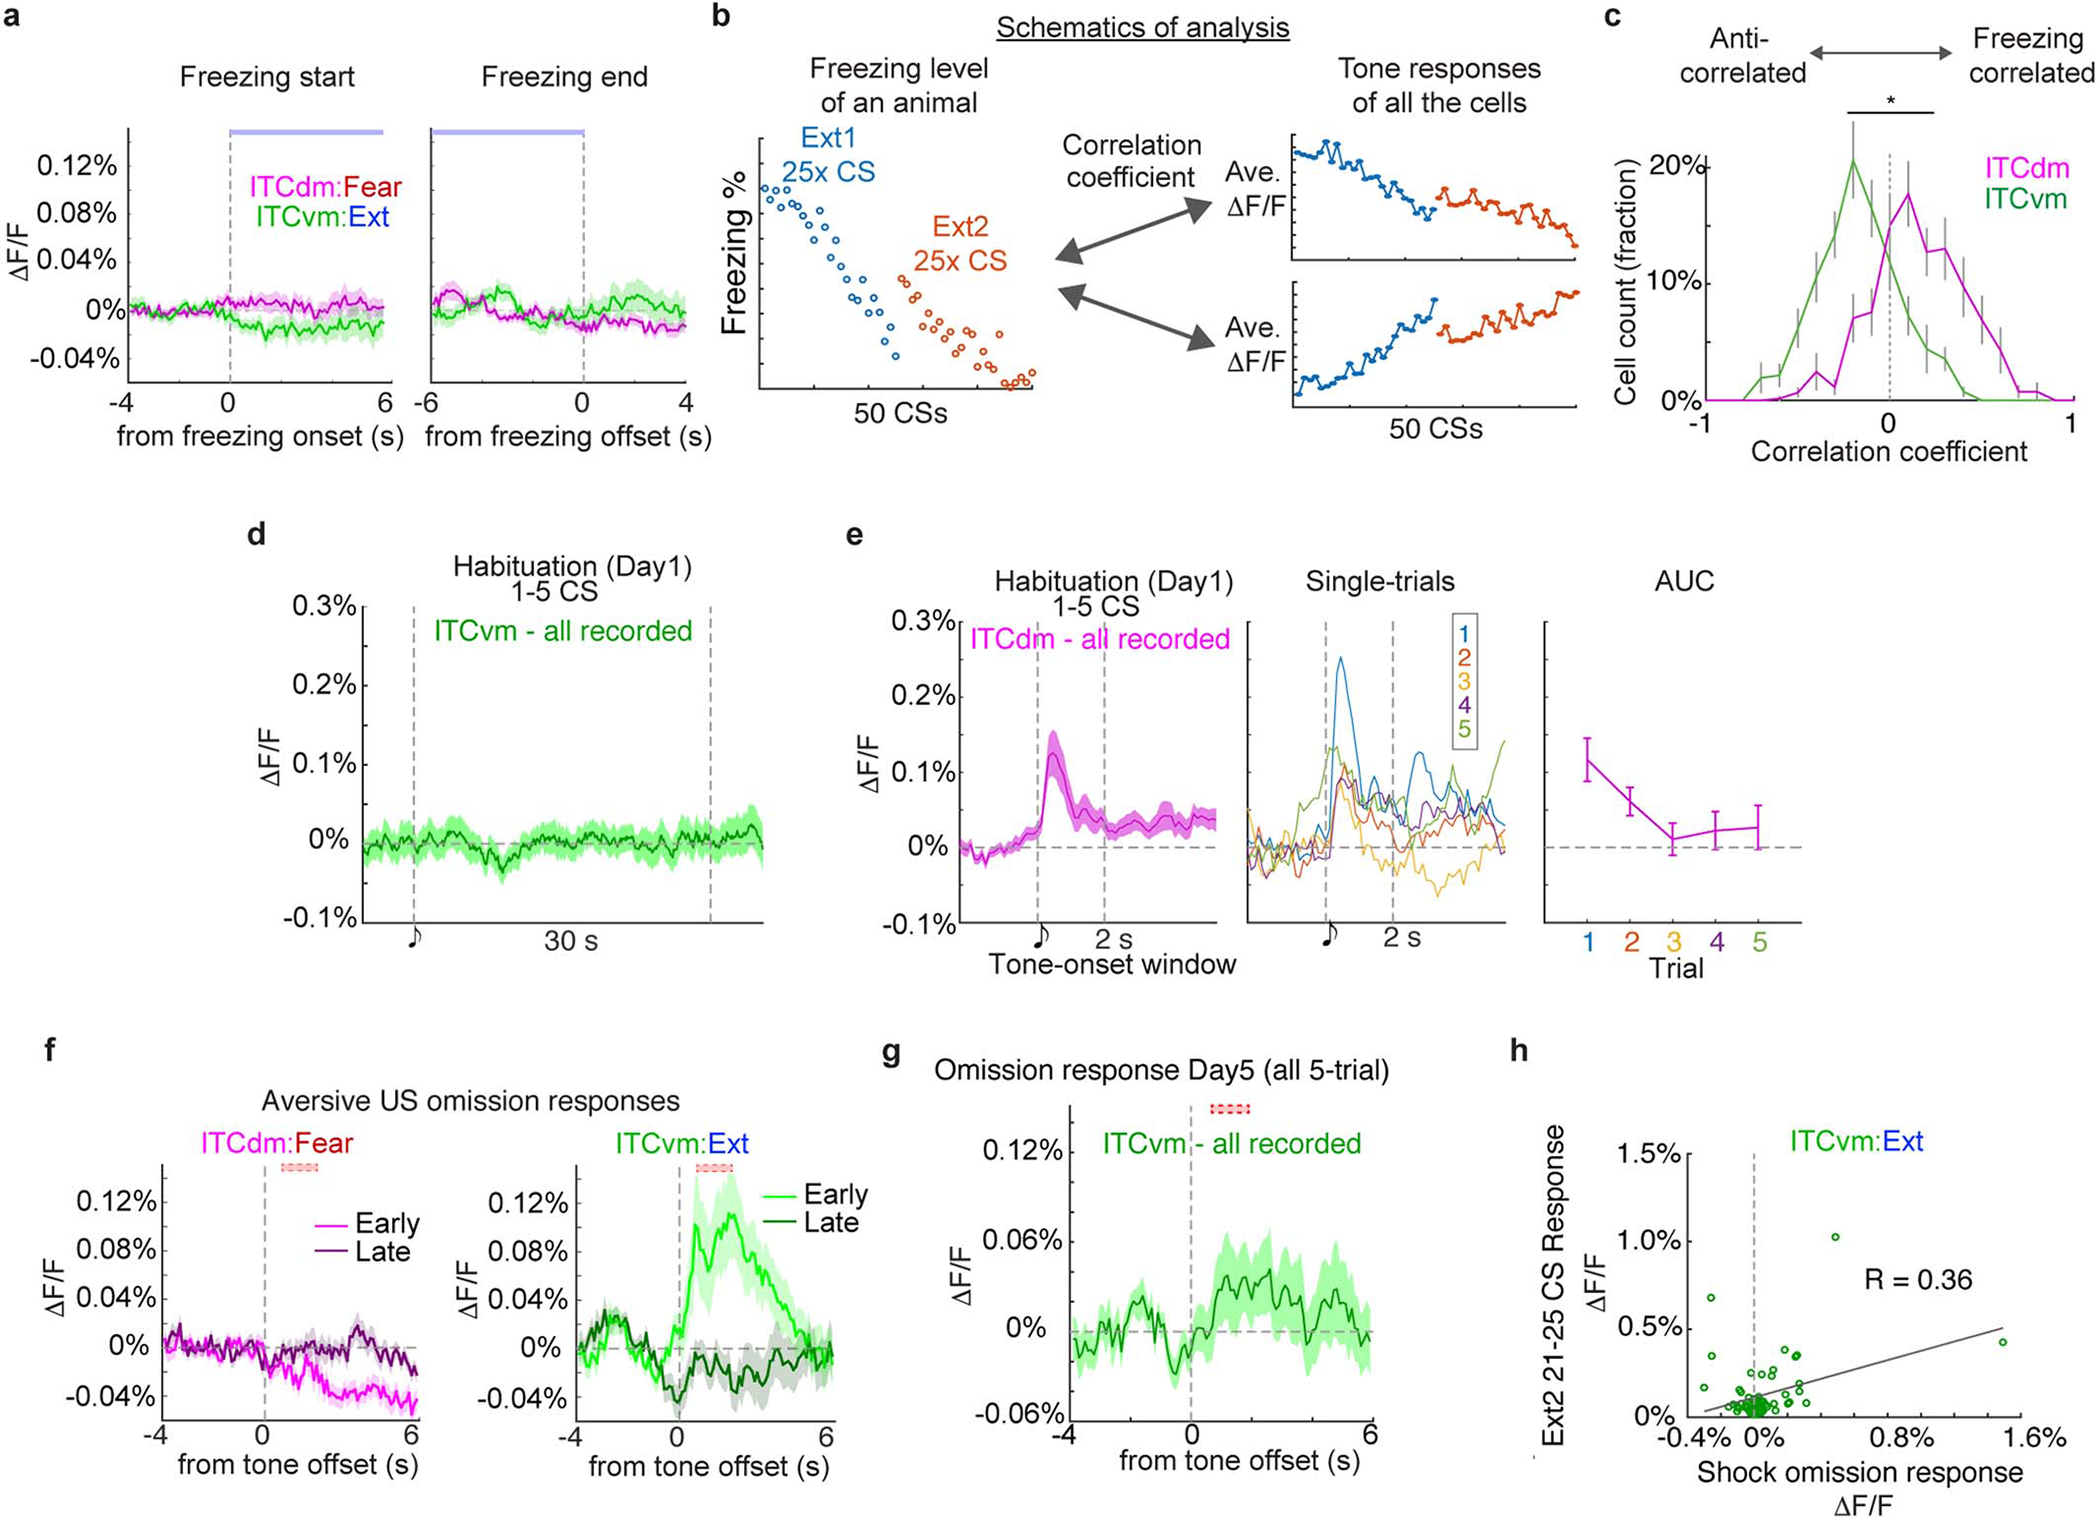
Extended Data Fig. 5 |. Properties of ITCdm and ITCvm neurons during fear extinction.
a, Trial-averaged ΔF/F Ca2+ responses of ITCdm Fear and ITCvm Extinction neurons aligned to freezing onset and offset.
b, Schematics illustrating the analysis shown in (c). Correlation coefficients between trial-by-trial (in total, 50 CS trials) freezing levels and CS-response amplitudes of all the recorded neurons across two days of extinction. Distribution of those correlation coefficients (one value from each neuron) were first normalized in each animal, then mean ± SEM values were acquired from all ITCdm and ITCvm recordings and visualized.
c, The distribution of correlation coefficients for ITCdm neurons was skewed towards 1, indicating a larger fraction showed a CS response pattern positively correlated with freezing behaviour. In contrast, ITCvm neurons exhibited the opposite tendency; a response pattern anti-correlated with freezing behaviour. *P = 1.64 × 10−40, Kolmogorov–Smirnov test.
d, Trial-averaged ΔF/F Ca2+ responses of ITCvm neurons aligned to tone on habituation (Day1).
e, (Left) Averaged Ca2+ responses to tone CS onset of ITCdm. Vertical dotted lines indicate onsets and 2 seconds time-window of CSs for AUC analysis. (Center) Single-trial average of all the ITCdm neurons. (Right) Area under the curve (AUC) quantification of single-trial responses shown in the Center panel. P = 0.027, one-way ANOVA.
f, Trial-averaged ΔF/F Ca2+ responses of ITCdm Fear and ITCvm Extinction neurons aligned to US omission on Day3. Early: CS1–5, Late: CS21–25. Dotted red boxes indicate the expected timing of US delivery.
g, Trial-averaged ΔF/F Ca2+ responses of all recorded ITCvm neurons aligned to US omission on Day5. The dotted red box indicates the expected timing of US delivery.
h, Relationship between CS responses during last 5 trials of extinction training on Day4 and US omission responses on Day3 in ITCvm Extinction neurons shows a weak positive correlation.
Extended Data Fig. 6 |. Simultaneous photometry recordings from ITCdm and ITCvm during state transition.
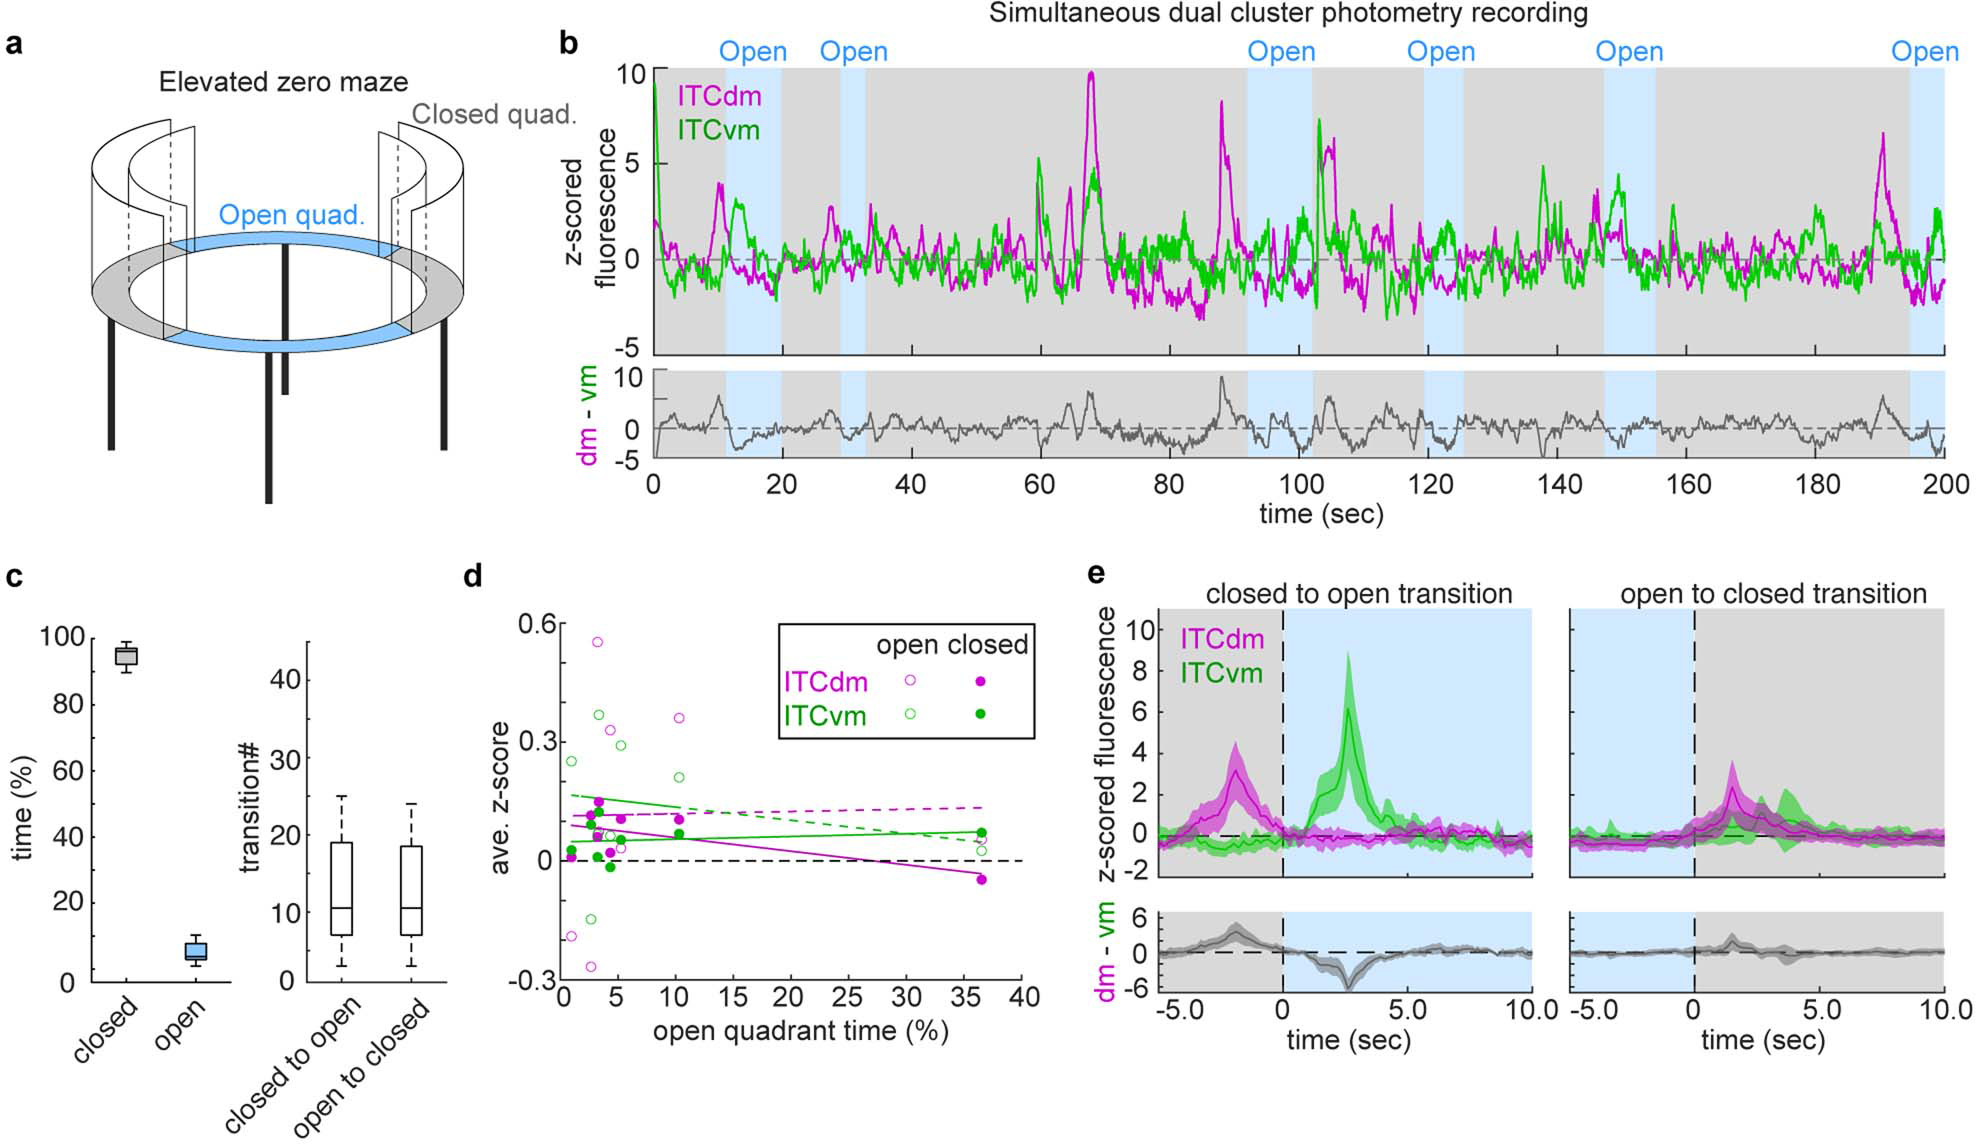
a, Schematic of an elevated zero-maze apparatus.
b, (Top) Example z-scored Ca2+ traces of simultaneously recorded ITCdm (magenta) and ITCvm (green) neurons with the corresponding location in the maze indicated with gray (closed quadrant) and blue (open quadrant) shading. (Bottom) Difference between the ITCdm and ITCvm signals.
c, (Left) Percentage of time spent in closed and open quadrants. (Right) Total number of transitions from close to open quadrants (15 ± 3.9, mean ± SEM) or from open to closed quadrants. N = 5 mice. Box plots represent the median and 25th and 75th percentiles, and their whiskers represent the data range.
d, Averaged activity of ITCdm or ITCvm neurons in the closed or open quadrants did not correlate with the total time spent in open quadrants. Regarding the larger variability in ITC activities in open quadrants, we note that the time an animal spent in open quadrants was, on average, much shorter than that in closed quadrants (c). As such, activity in open quadrants was to a lesser extent averaged out, resulting in higher variability. 8 sessions from N = 5 mice.
e, (Top) Averaged Ca2+ traces during transitions between quadrants. Changes in the balance between ITCdm and ITCvm parallel a transition from a closed to an open quadrant. (Bottom) Difference between the ITCdm and ITCvm signals.
Briefly stated, the results of this experiment make at least three important points: 1) the role of the ITC clusters extends beyond signaling acute, cue-triggered fear states to conditioned fear stimuli to encompass state transitions during exploration of a potentially threatening environment, 2) the clusters exhibit markedly divergent, opposing responses to transitions between protected and unprotected environments, as they do in response to conditioned and extinguished fear cues, 3) the pattern of results shows that increased ITCvm activity occurs when the animal moves from the protected, closed, to the unprotected, open, quadrants. Potentially, this increase in ITCvm neuron activity may serve to inhibit defensive behaviour and thereby enable exploration of the unprotected open quadrants, analogous to the inhibition of freezing behaviour following extinction. Such cross-task neuronal function is not without precedent, for example BLA neuronal activity during elevated plus-maze open arm exploration is anti-correlated with conditioned freezing behaviour in the same mice60.
Extended Data Fig. 7 |. Ex vivo validation of KORD.
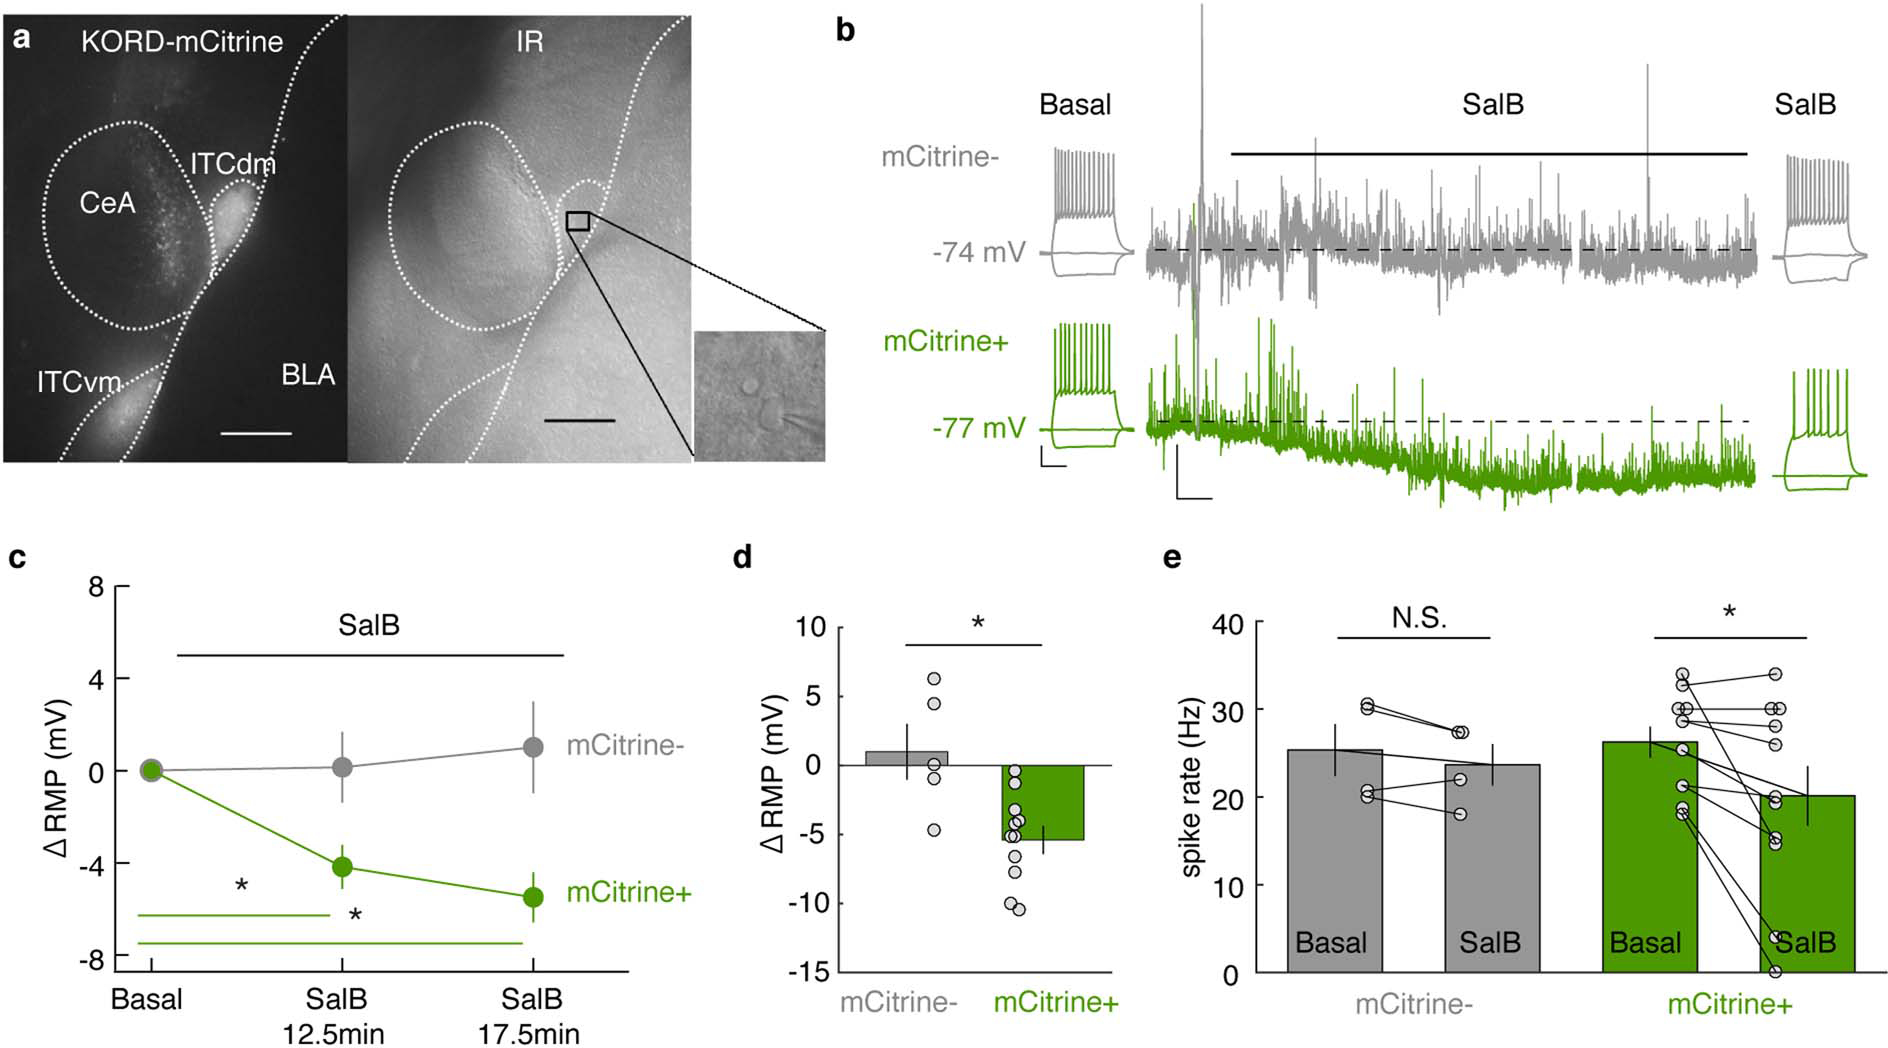
a, Fluorescence (mCitrine, left) and infrared (IR, right) images from a slice used for recordings in a FoxP2-Cre mouse injected with an AAV-DIO-KORD-mCitrine into ITCdm and ITCvm. Inset: Infrared image from a recorded ITCdm neuron. Scale bar: 200 μm.
b, Representative current-clamp traces illustrating supra-threshold responses to a +60 pA current injection and continuous recording of the resting membrane potential (RMP) during application of Salvinorin B (SalB, 100 nM) from control (mCitrine−) and KORD-infected (mCitrine+) ITC neurons. Scale bars: RMP: 5 mV, 1 min; current steps: 20 mV, 200 ms.
c, SalB application induced a significant hyperpolarization of the membrane potential in mCitrine+ neurons (n = 10 neurons from 4 mice) at both time points vs. baseline (12.5-min: * P = 0.003, 17.5-min: * P = 0.0001, Two-sided Dunnett’s test). Changes in membrane potential were not significant in the mCitrine− control neurons (n = 5 neurons from 3 mice) at both time points vs. baseline (12.5-min: P = 0.99, 17.5-min: P = 0.84, Dunnett’s test). Error bars: mean ± SEM
d, Comparison of membrane potential changes (ΔRMP) at 17.5 min after application of SalB. Changes in KORD-infected neurons (mCitrine+) were significantly different from control (* P = 0.013, Wilcoxon rank-sum test; n = 5 neurons from 3 mice and n =11 neurons from 5 mice for mCitrine− and mCitrine+, respectively). Error bars: mean ± SEM
e, Comparisons of spike rates in response to +60 pA current injections before and 17.5 min after application of SalB. KORD-infected neurons (mCitrine+, n = 11) significantly reduced spike rate (from 26.2 ± 1.69 Hz to 20.1 ± 3.30 Hz, * P = 0.016, Wilcoxon signed-rank test). In contrast, mCitrine- neurons (n = 4 neurons from 3 mice) did not show a significant reduction in spike rate (from 25.3 ± 2.89 Hz to 23.7 ± 2.27 Hz, P = 0.25, Wilcoxon signed-rank test). Error bars: mean ± SEM
Extended Data Fig. 8 |. Histology for chemogenetic manipulations of distinct ITC clusters.
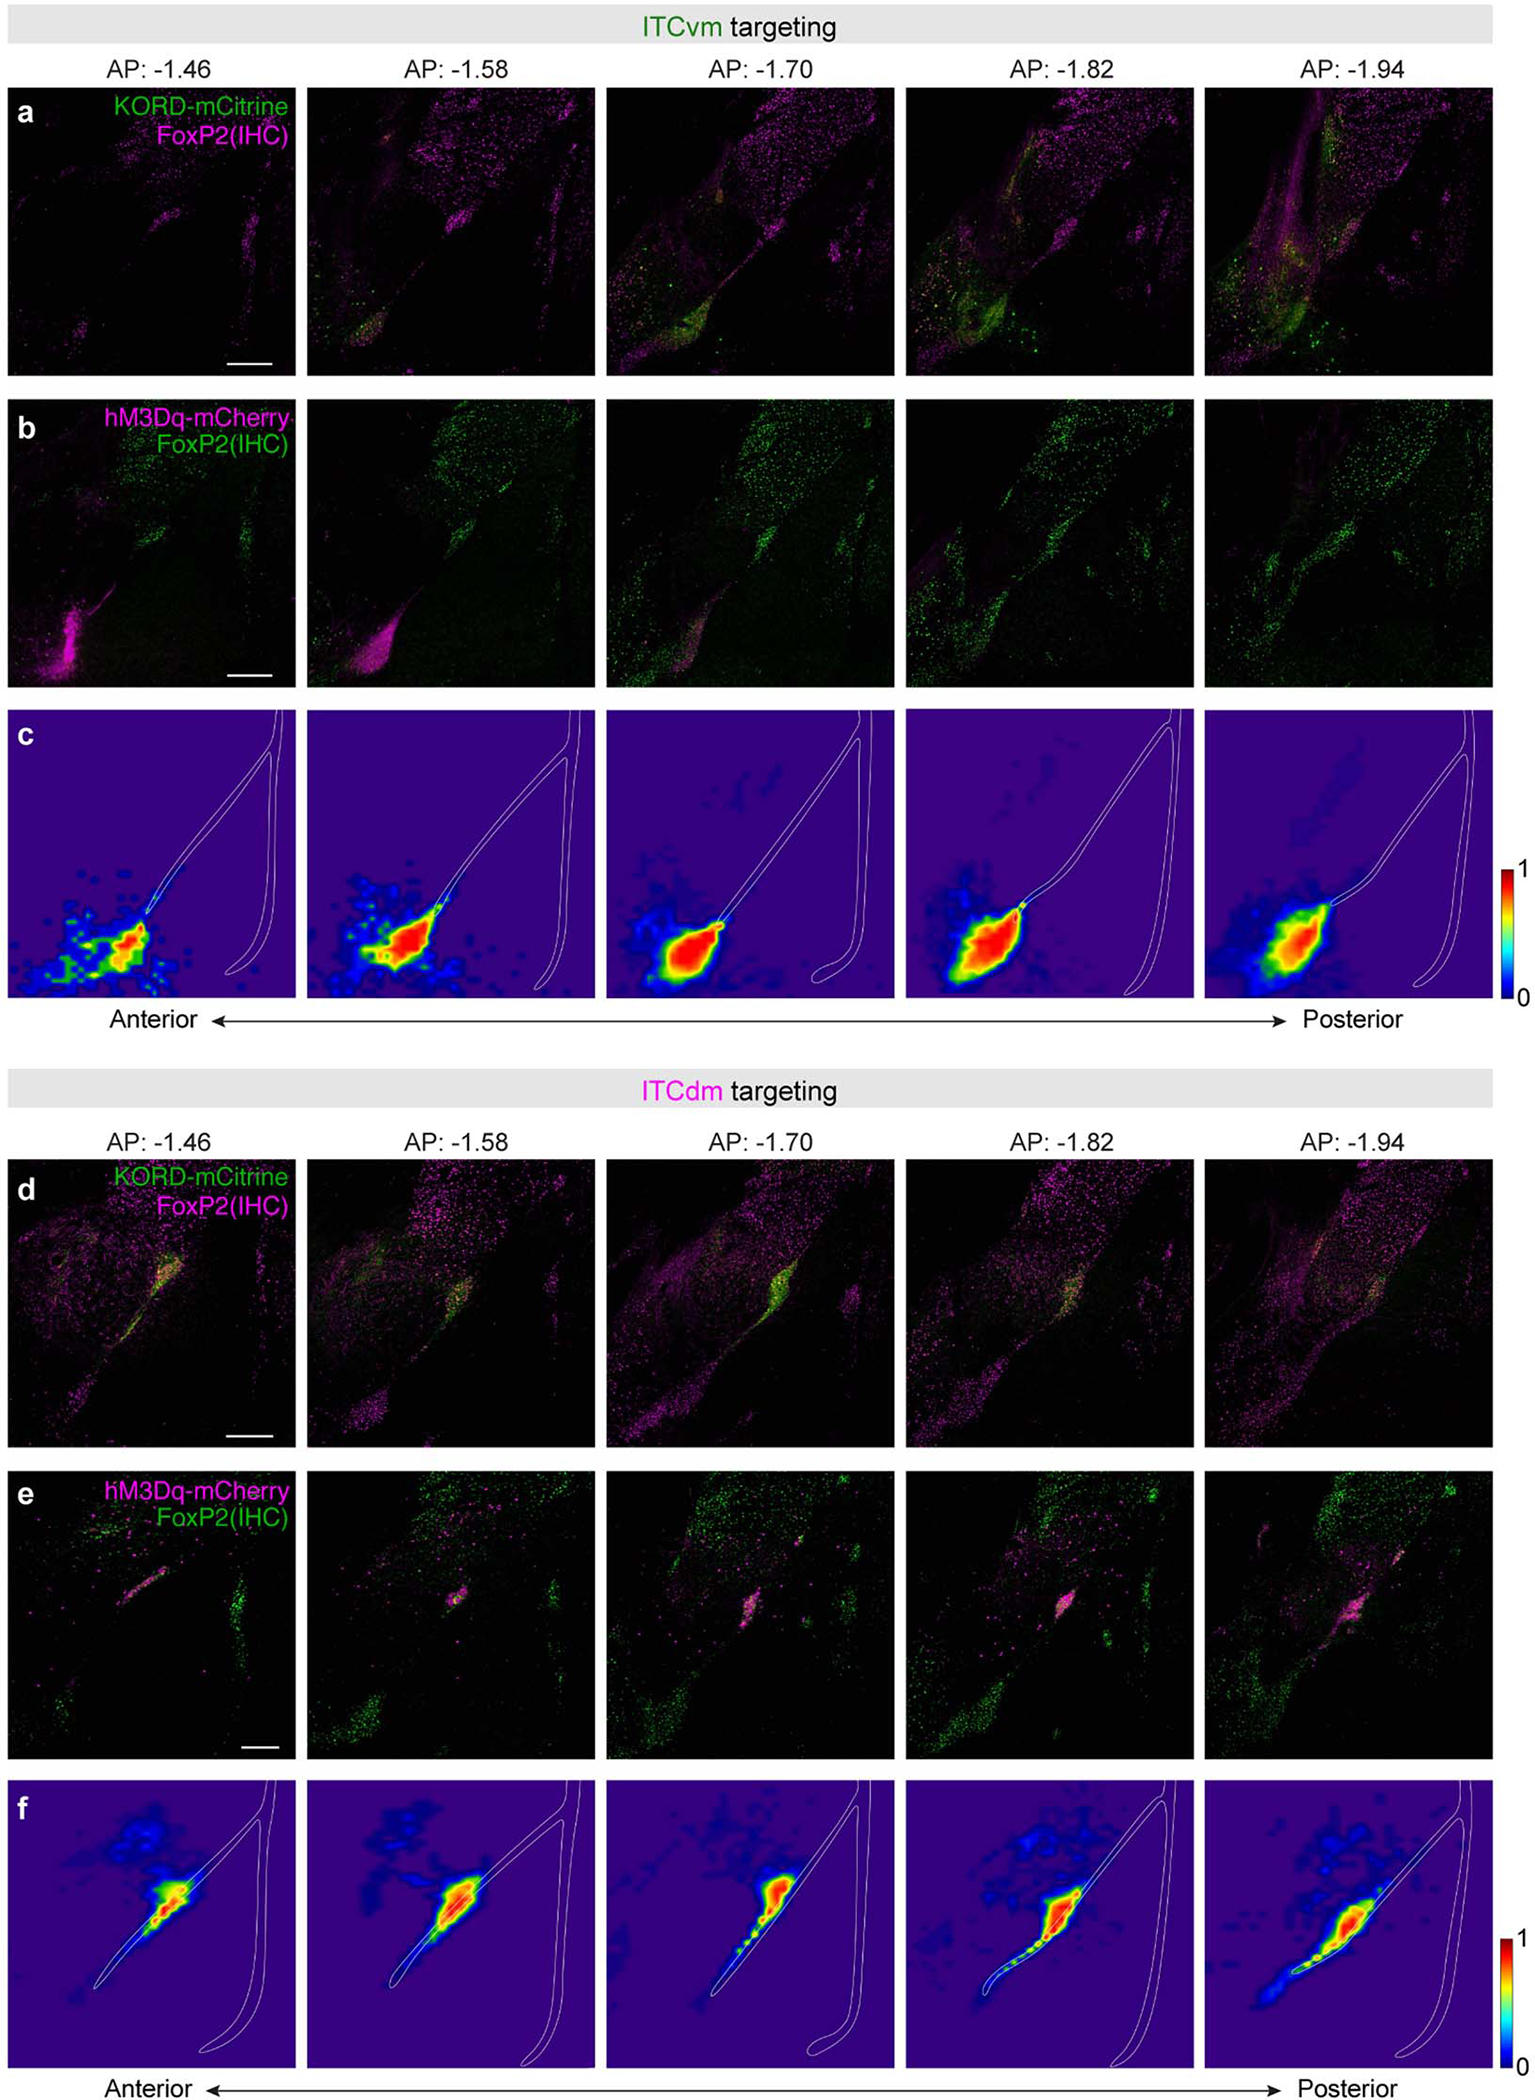
a, Examples of histological validation of KORD-mCitrine expression in ITCvm neurons across multiple anterior-to-posterior coronal sections. Following all the behavioural experiments (Fig. 3), mice were sacrificed and slices (50 μm) cut and stained with an anti-FoxP2 antibody. Scale bar: 200 μm.
b, Examples of histological validation of hM3Dq-mCherry expression in ITCvm neurons across multiple anterior-to-posterior coronal sections. Scale bar: 200 μm.
c, Heatmaps illustrating virus expression aggregated across Cre+ mice in (a) and (b). Scale bar indicates the fraction of animals exhibiting expression at each locus (0: no mice expressed; 1: all mice expressed).
d, Examples of histological validation of KORD-mCitrine expression in ITCdm neurons across multiple anterior-to-posterior coronal sections. Scale bar: 200 μm.
e, Examples of histological validation of hM3Dq-mCherry expression in ITCdm neurons across multiple anterior-to-posterior coronal sections. Scale bar: 200 μm.
f, Heatmaps illustrating virus expression aggregated across Cre+ mice in (d) and (e). Scale bar indicates the fraction of animals exhibiting expression at each locus (0: no mice expressed; 1: all mice expressed). Bregma levels are note above the panels in (a) and (d).
Extended Data Fig. 9. Additional chemogenetic manipulations of ITCdm and ITCvm clusters.
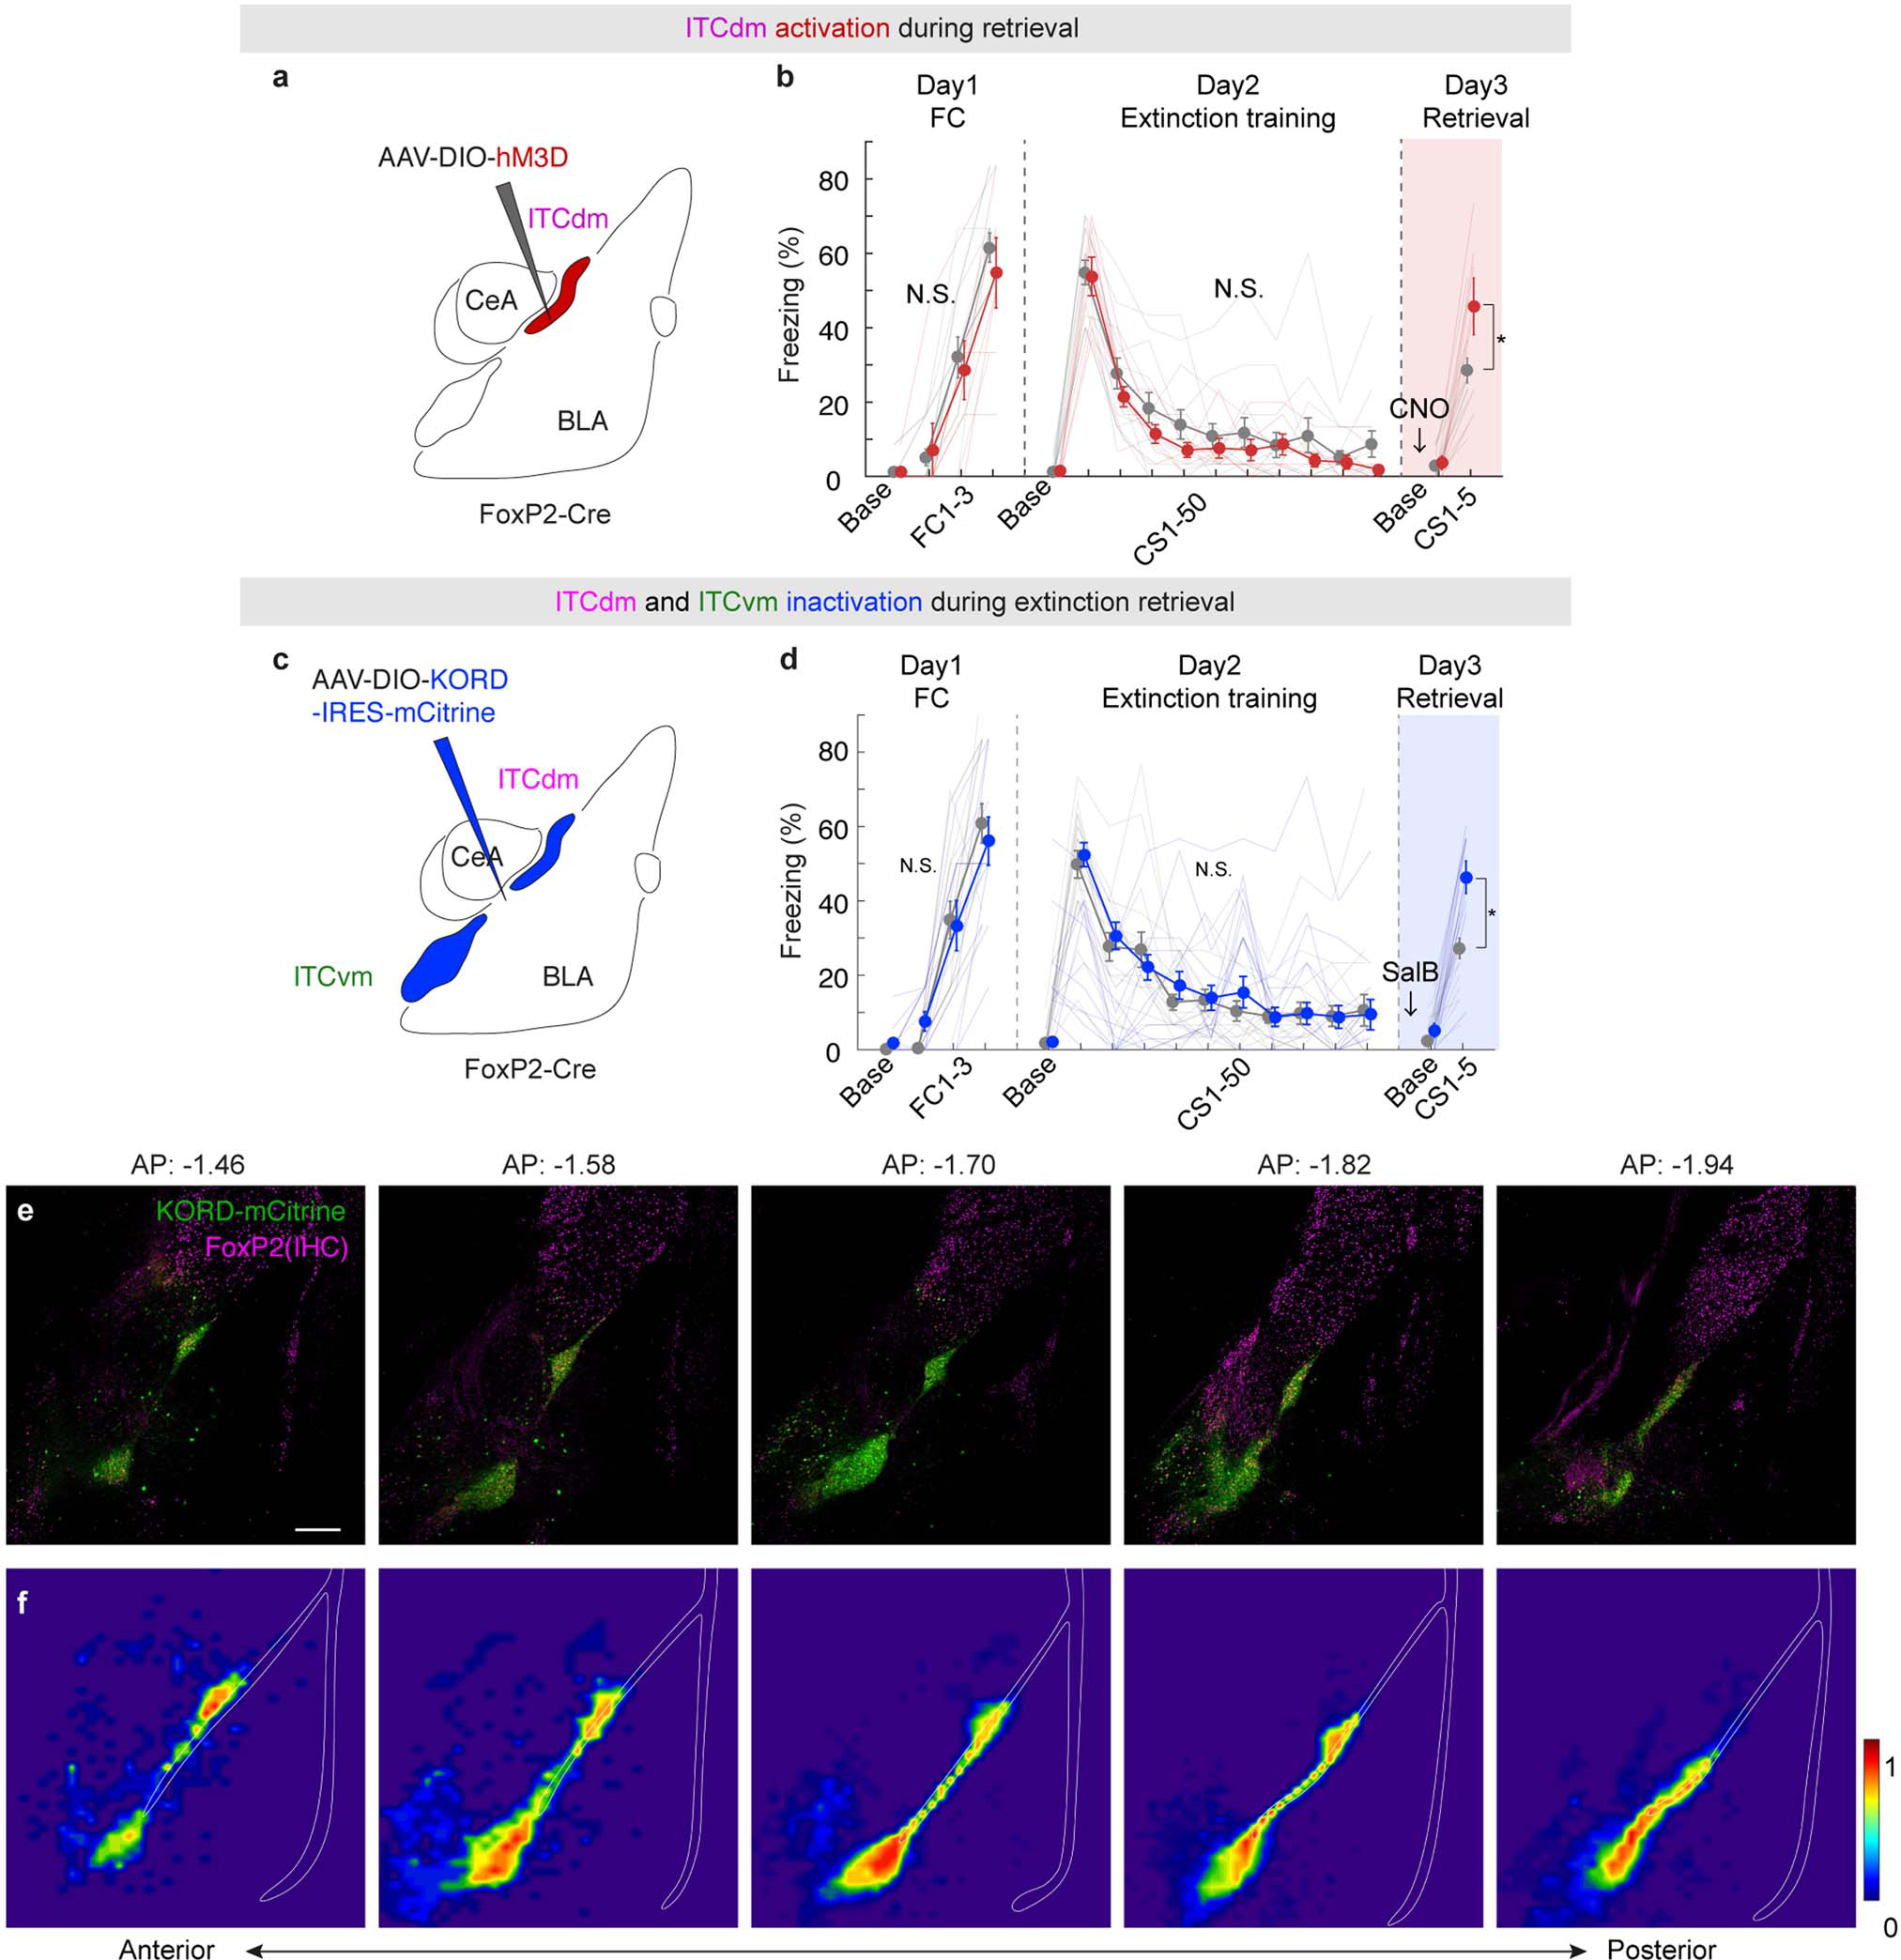
a, Chemogenetic manipulations. AAV encoding Cre-dependent hM3Dq targeted to ITCdm neurons in FoxP2-Cre mice.
b, ITCdm activation. Freezing on retrieval: Cre+: 45.7±7.6%; Cre−: 28.5±3.3%; *P=0.0044
c, Schematic showing the dual-cluster chemogenetic manipulation experiment. An AAV encoding Cre-dependent KORD was targeted to both ITCvm and ITCdm neurons in FoxP2-Cre mice.
d, Freezing behaviour of experimental (Cre+) and control (Cre−) mice; controls were injected with the AAV and administered with the ligand. Arrows and colour-shadings indicate the timing of SalB administration prior to extinction retrieval. Freezing levels on extinction retrieval (Day3): Cre+: 46.4 ± 4.3%; Cre−: 27.3 ± 2.7%; * P < 0.0001, repeated measures ANOVA followed by Sidak post-hoc test; N.S.: not significant differences on Day1 or Day2 freezing. Error bars: mean ± SEM
e, Examples of histological validation of KORD-mCitrine expression in ITCvm and ITCdm neurons across multiple anterior-to-posterior coronal sections. Following behavioural experiments, mice were sacrificed and slices (50 μm) cut and stained with an anti-FoxP2 antibody. Scale bar: 200 μm.
f, Heatmaps illustrating virus expression aggregated across Cre+ mice. Scale bar indicates the fraction of animals exhibiting expression at each locus (0: no mice expressed; 1: all mice expressed).
Extended Data Fig. 10 |. Reciprocal inhibitory connections between ITC clusters.
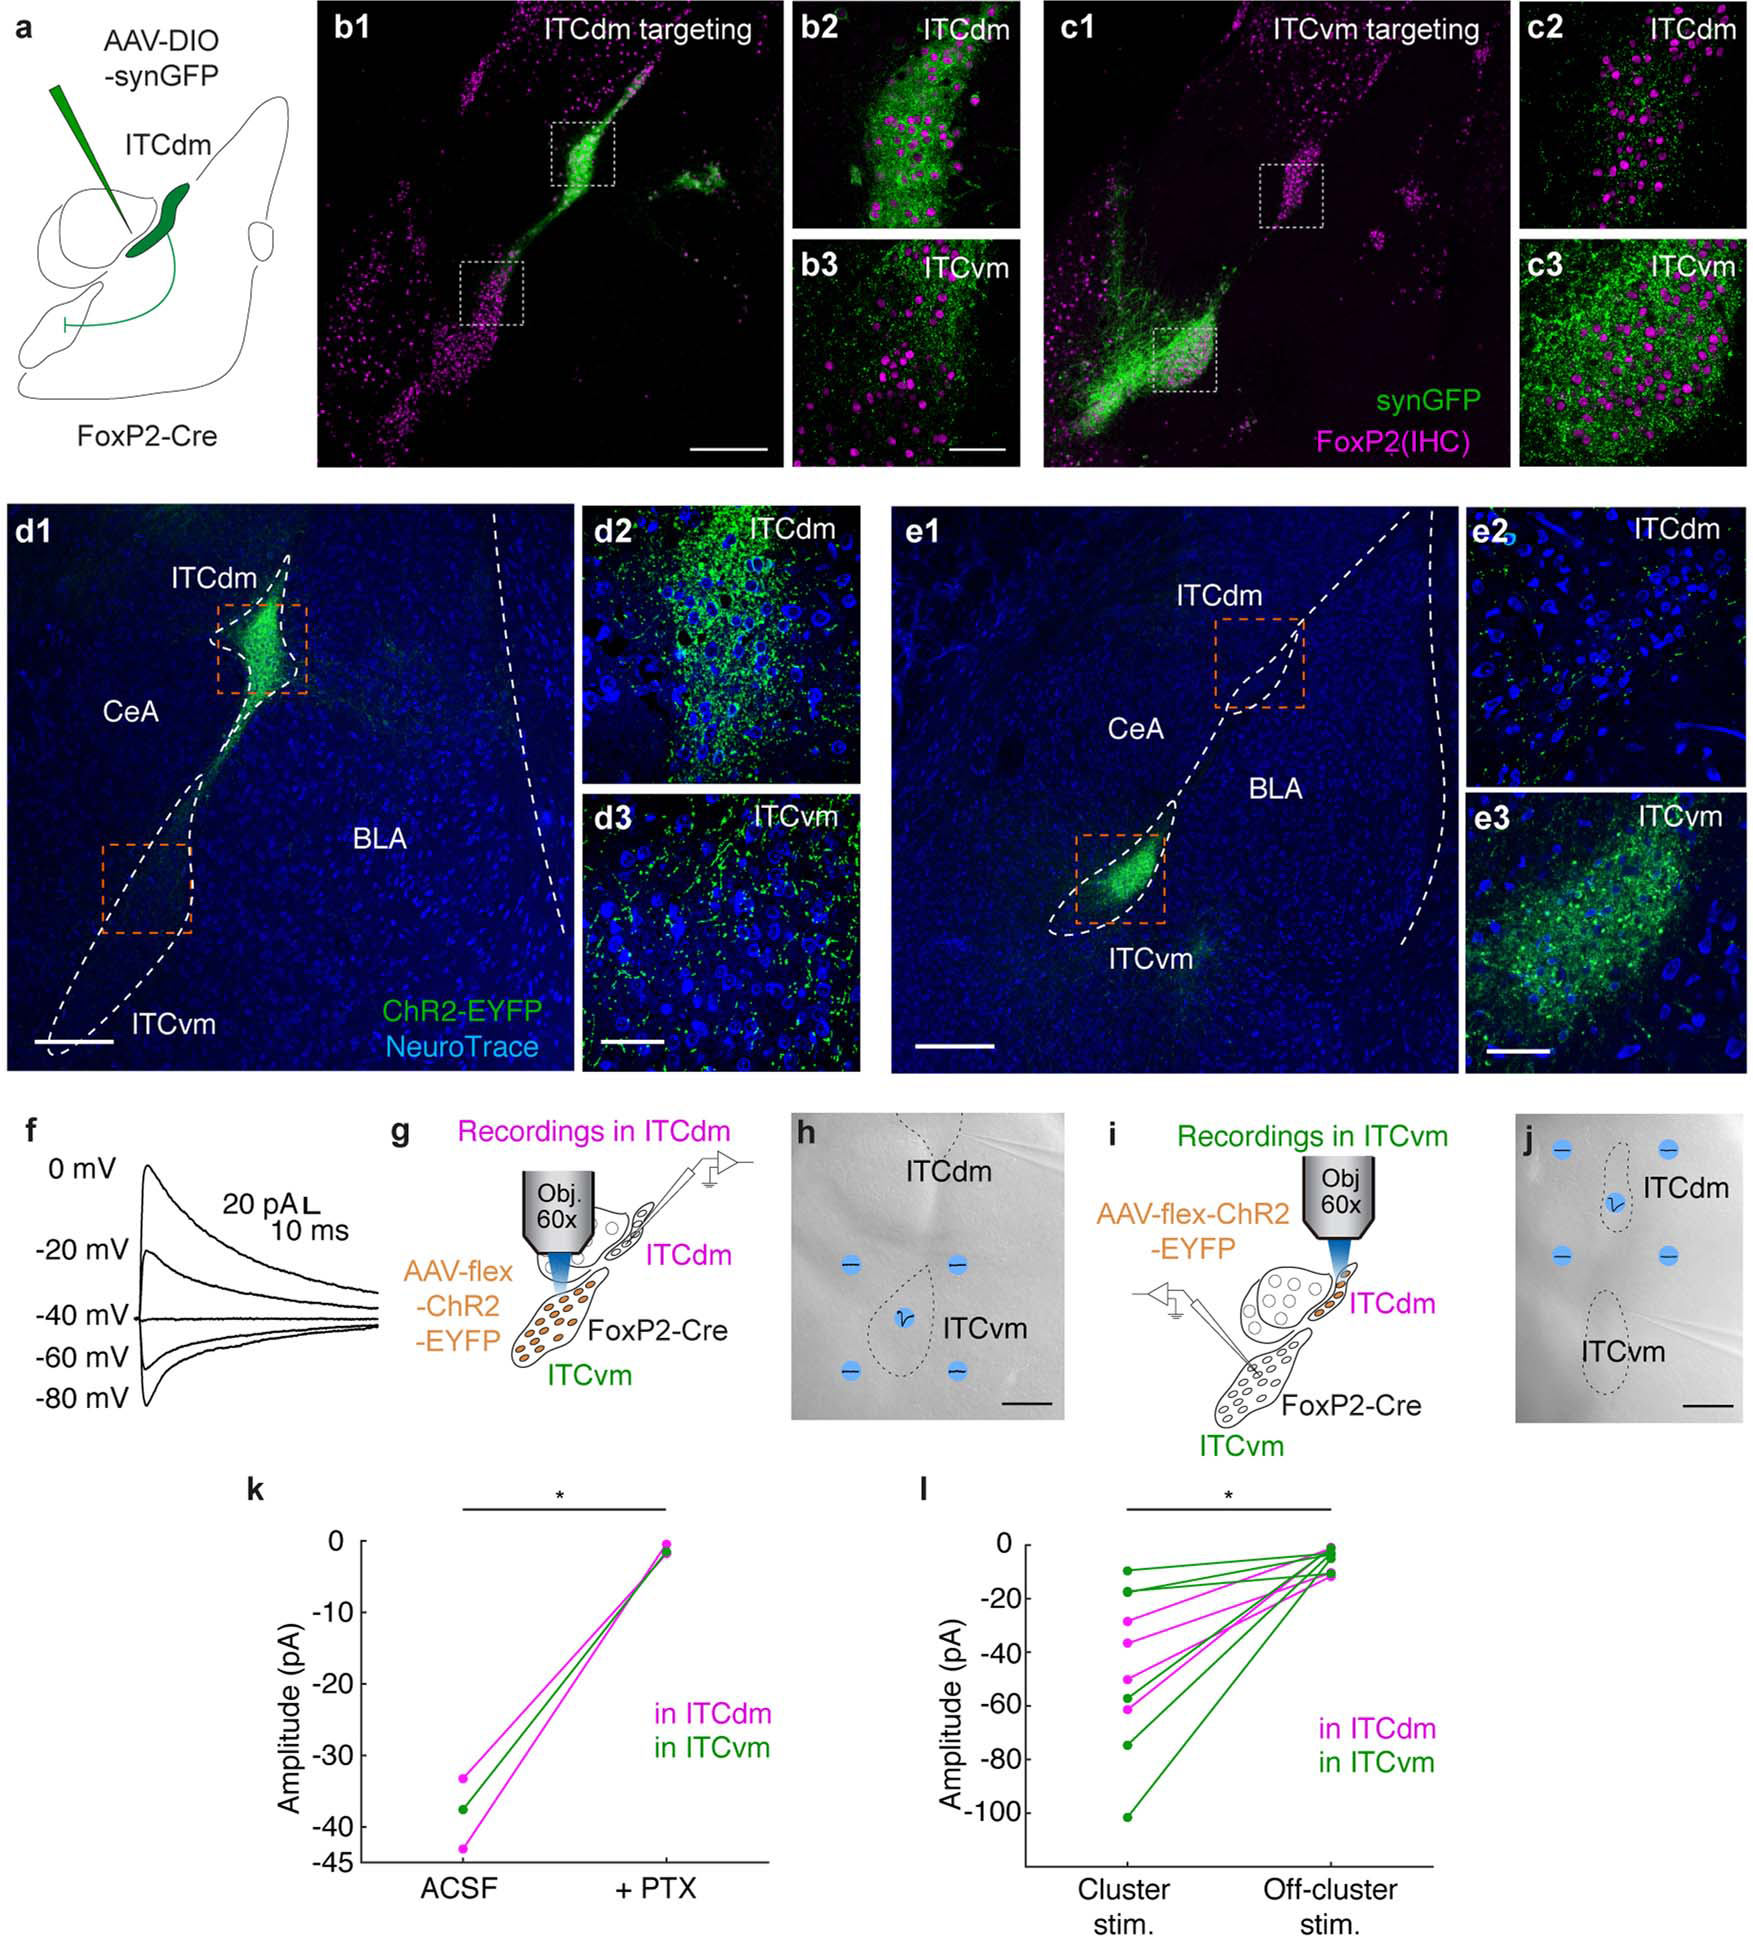
a, Inter-cluster virus-based tracing (ITCdm-targeted example shown, same strategy for ITCvm-targeting). AAV encoding Cre-dependent synaptophysin-GFP targeted to ITCdm or ITCvm neurons in FoxP2-Cre mice.
b,c, Confocal images from ITCdm (b) or ITCvm (c) injections. FoxP2 expression visualized via immunohistochemistry (IHC). Injections repeated in 5 (ITCdm), and 4 (ITCvm) mice. Scale bars: 500 μm (b1, c1); 200 μm (b2–3, c2–3).
d,e, Histological validation of selective ChR2 expression in ITCdm (d1–3) and ITCvm (e1–3). Scale bars: 500 μm (d1,e1); 50 μm (d3,e3). Repeated for all the mice shown in Fig. 4.
f, Representative example of IPSCs recorded at different holding potentials from an ITCdm neuron.
g,i, Schematic illustrating ex vivo slice electrophysiological experiments with direct cluster stimulation. The ITCvm (g) or ITCdm (i) cluster was targeted with an AAV encoding Cre-dependent ChR2. Recordings were performed in the other cluster while selectively photostimulating the ChR2-positive cluster or the surrounding area with aperture-restricted stimulation (see Methods).
h,j, Images taken from the recording setup illustrating positions of on- and off-cluster stimulation for ITCvm while recording in ITCdm and vice versa.
k, Summary of PTX application experiments (n = 3 from 3 mice). Magenta lines represent ITCvm → ITCdm connections and green lines represent ITCdm → ITCvm connections. * P = 0.005, paired t-test.
l, Summary of experiments shown in (g)-(j). On-cluster photostimulation evoked significantly larger IPSCs than off-cluster stimulation. Note, the highest value out of the 4 off-cluster stimulation sites were used. * P = 0.0016, paired t-test.
Extended Data Fig. 11 |. Selective ex vivo ITC cluster stimulation.
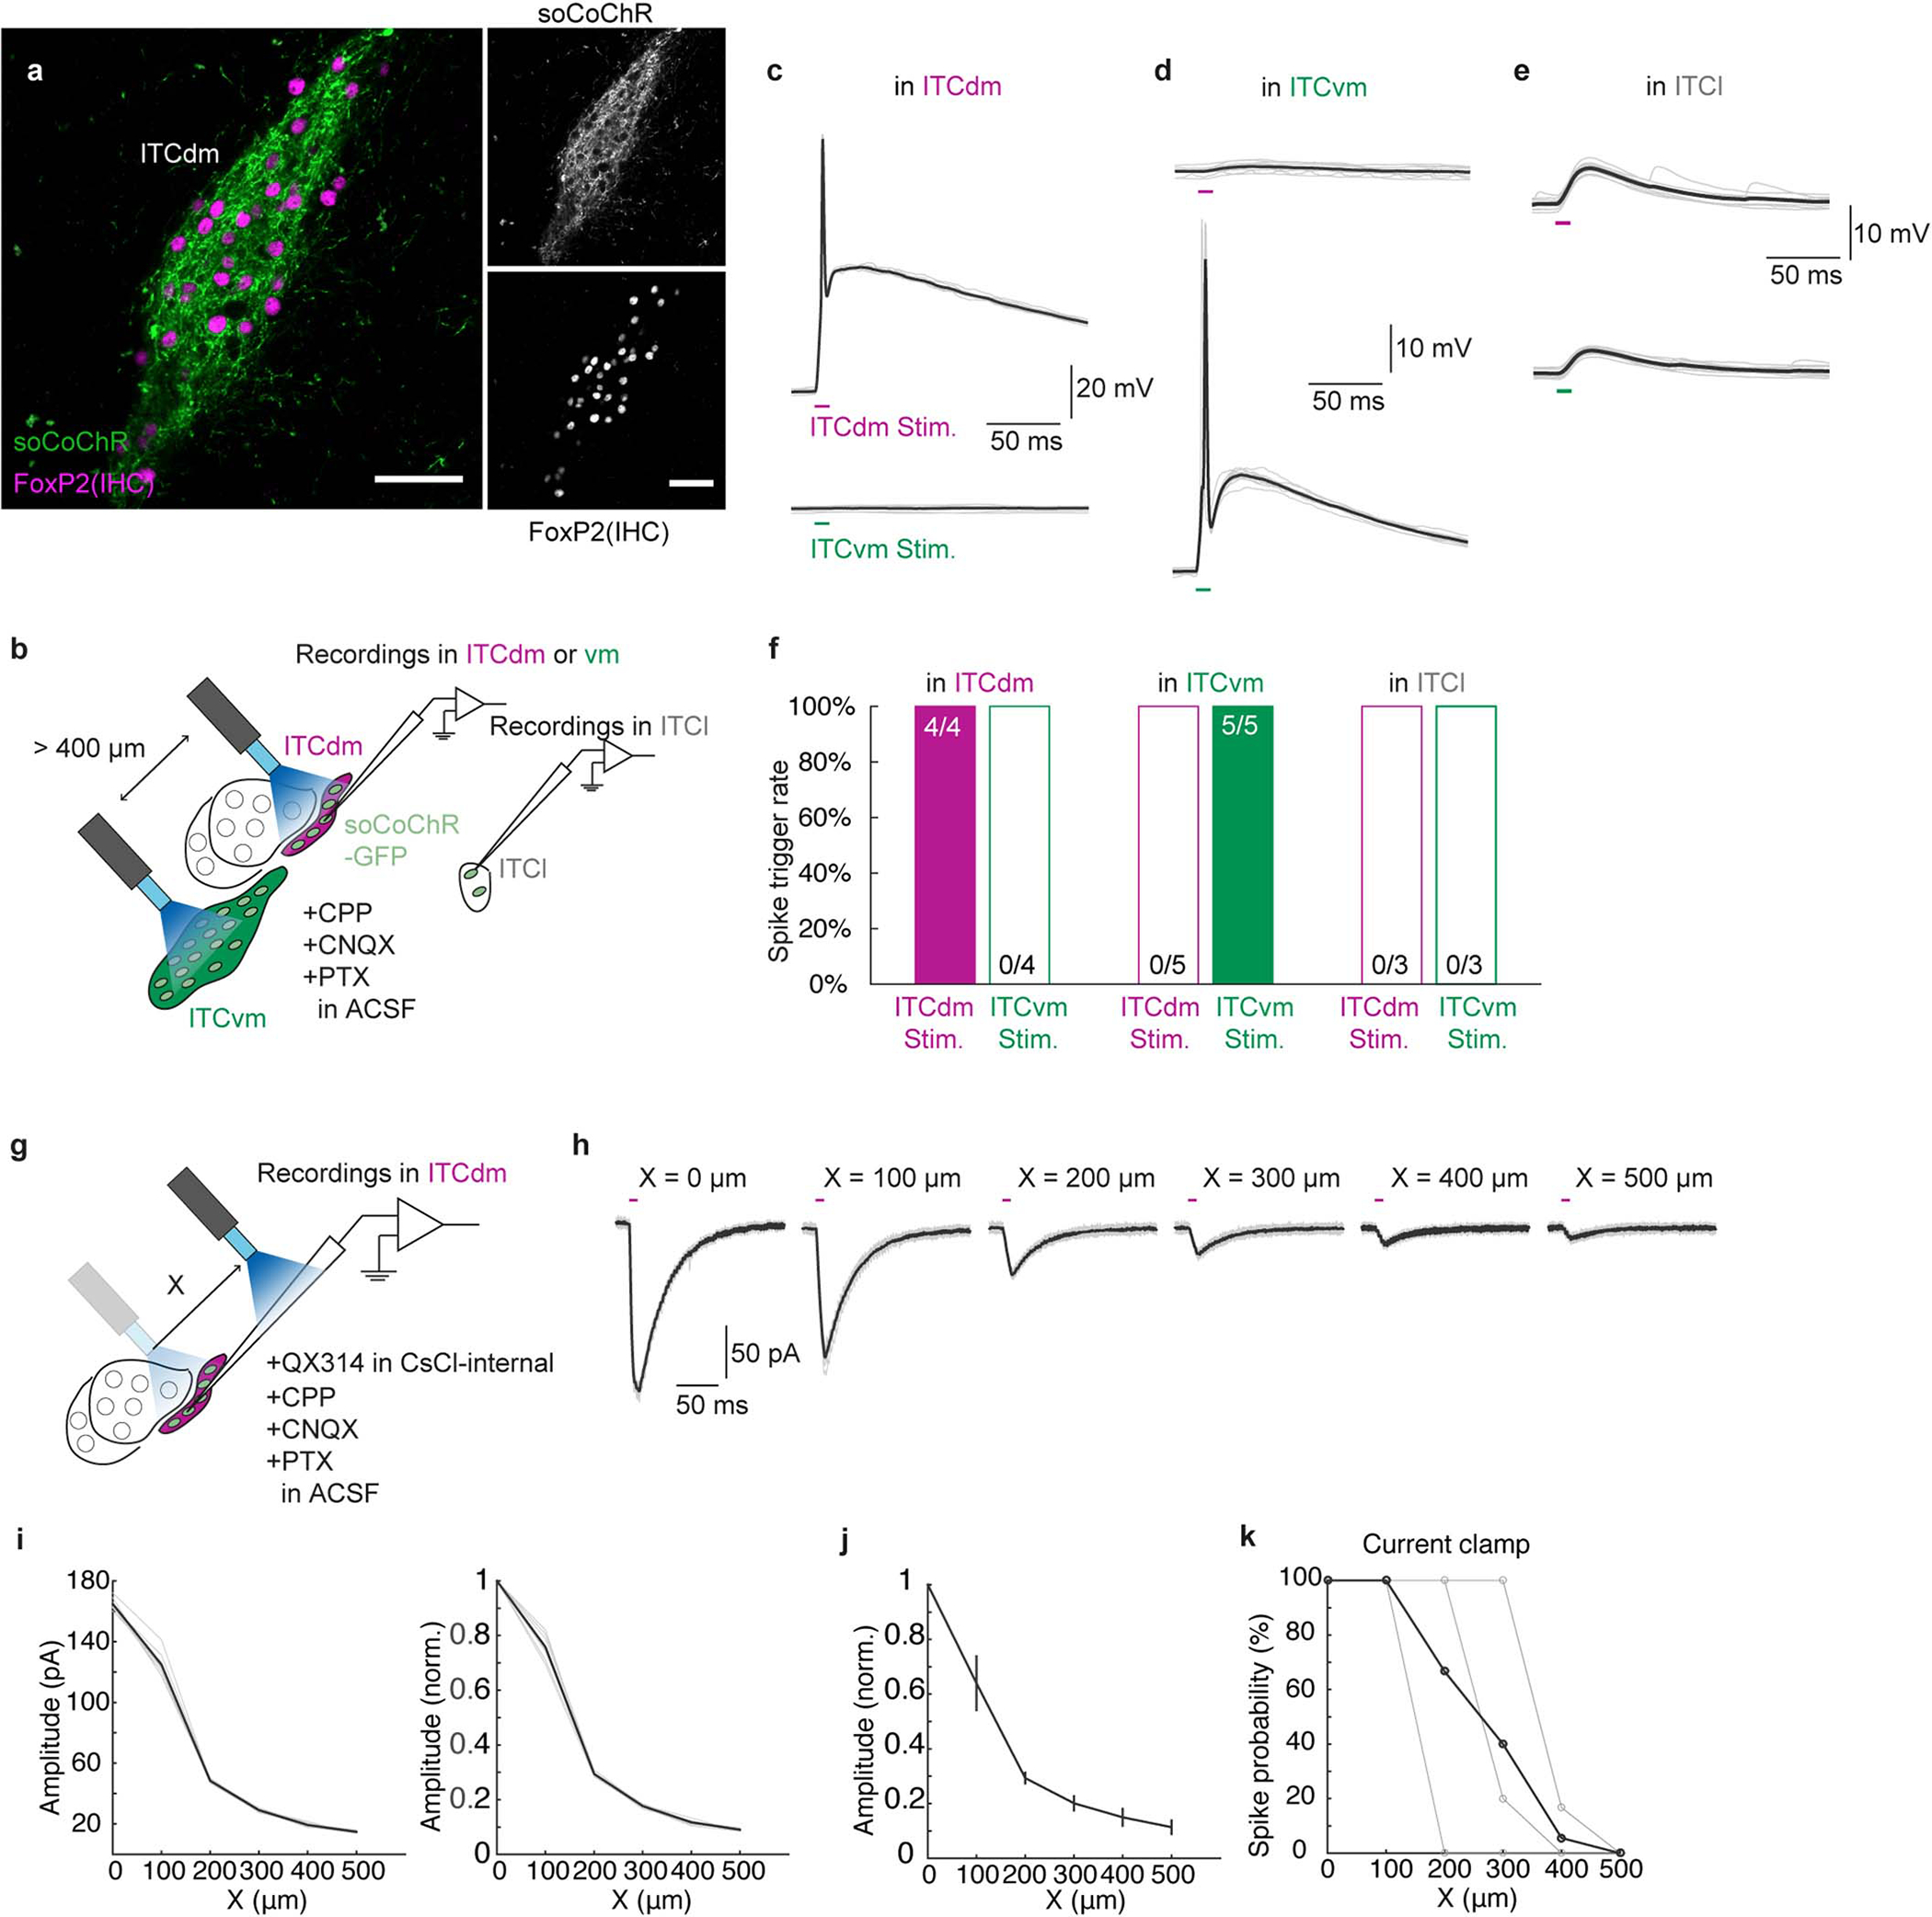
a, Histological validation of selective soCoChR expression. Scale bars: 50 μm. Repeated for N = 3 mice.
b, Schematic illustrating ex vivo slice electrophysiological experiments. ITCdm and ITCvm neurons were targeted with an AAV encoding Cre-dependent soCoChR. Two optical fibres for photostimulation were placed above the ITC clusters. Whole-cell recordings were performed from neurons in the ITCdm, ITCvm, and lateral ITC (ITCl) clusters. To block synaptic currents, CPP (10 μM), CNQX (10 μM), and PTX (100 μM) were applied.
c-e, Example responses to photostimulation of ITCdm or ITCvm clusters recorded under current-clamp configuration from ITCdm (c), ITCvm (d), and ITCl (e) neurons.
f, Summary of experiments shown in b-e. All recorded ITCdm and ITCvm neurons fired action potentials selectively in response to photostimulation with the corresponding fibre. ITCl neurons did not fire action potentials upon photostimulation of ITCdm or ITCvm clusters.
g, Schematic illustrating experiments wherein the position of the optical fibre was systematically moved away from the optimal location (X = 0 μm). To block synaptic currents, CPP (10 μM), CNQX (10 μM), and PTX (100 μM) were applied. These experiments further confirm spatial resolution of the photostimulation configuration.
h, Example voltage-clamp recordings from an ITC neuron showing IPSCs evoked at different positions of the optical fibre.
i,Left: Quantification of peak IPSC amplitudes of the neuron shown in (h). Right: Normalized by the value at X = 0 μm.
j, Summary of all recorded neurons (n = 3 from 3 mice).
k, Summary of additionally performed current-clamp recordings (n = 3 from 3 mice).
Extended Data Fig. 12 |. ITC to CeM connectivity.
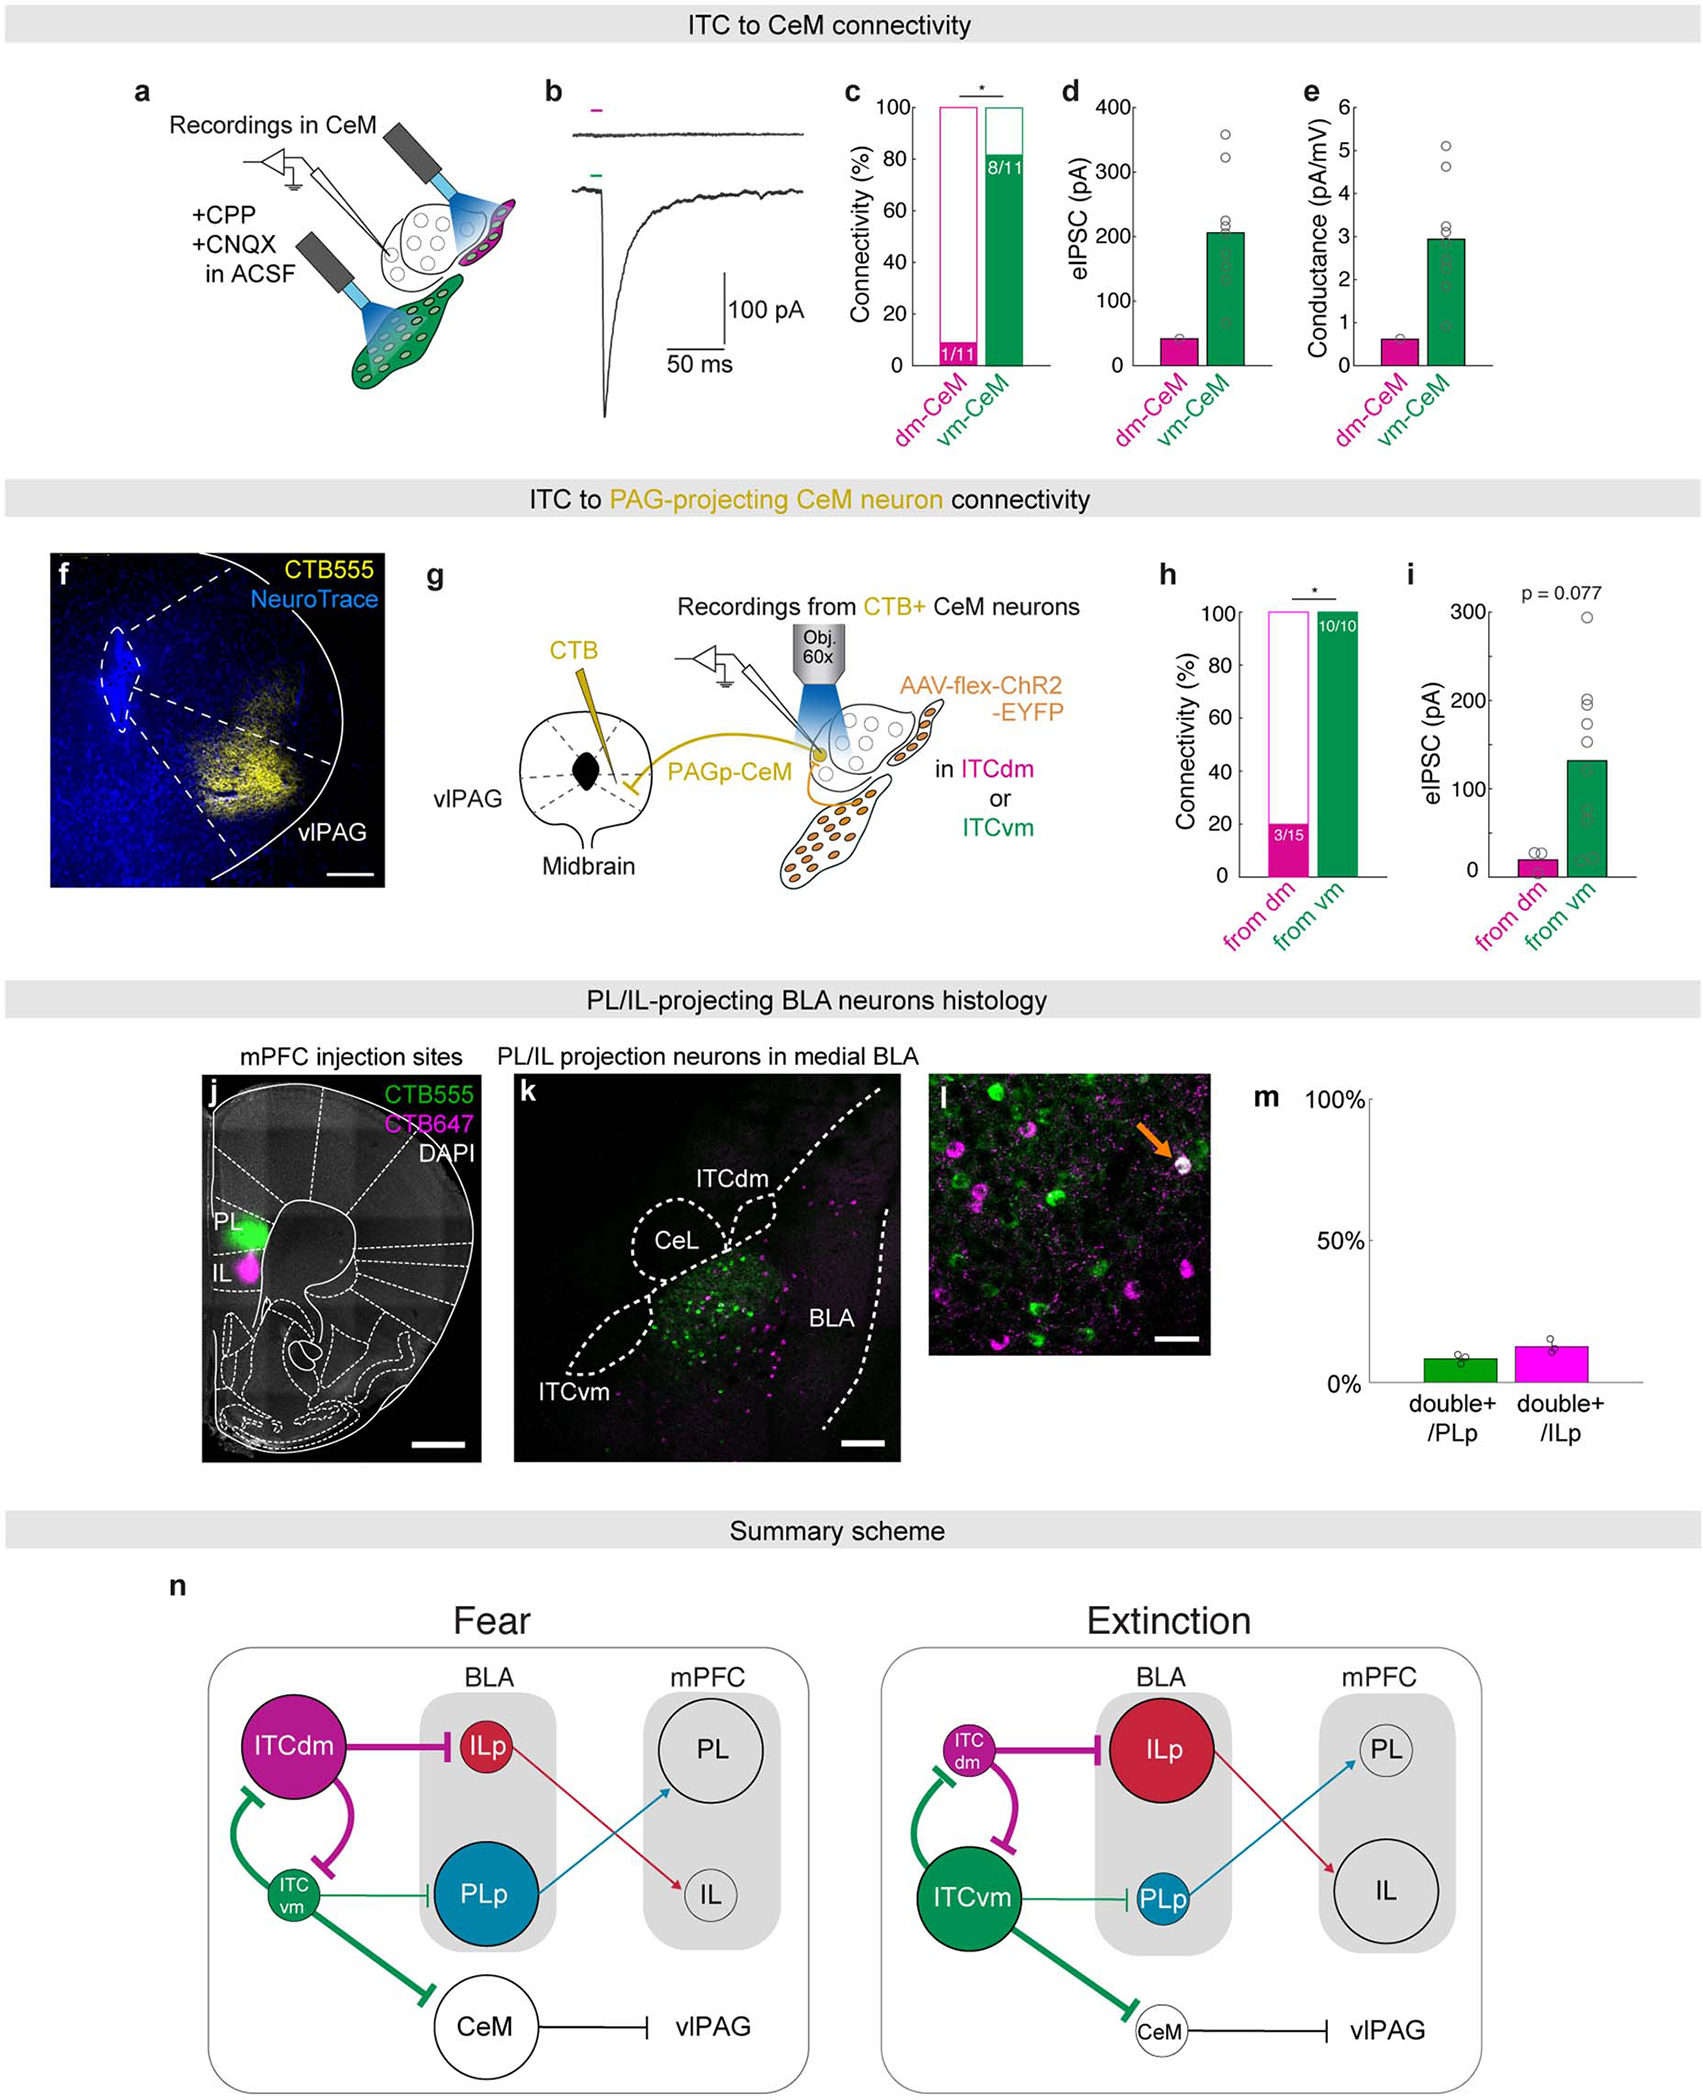
a, Schematic illustrating the experimental design used to assess connectivity between ITCdm or ITCvm neurons and CeM neurons. To isolate IPSCs, CPP (10 μM) and CNQX (10 μM) were applied.
b, Example voltage-clamp recording from a CeM neuron showing selective IPSC elicited by stimulation of the ITCvm but not ITCdm.
c, Summary of connectivity from ITCdm and ITCvm to CeM (n = 11 neurons from 4 mice). * P = 7.5 × 10⁻³, Fisher’s exact test.
d, Evoked IPSC amplitudes recorded from CeM neurons (at −70mV holding potential) in response to stimulation of ITCdm or ITCvm clusters.
e, Synaptic conductance calculated based on IPSC amplitudes recorded at three different holding potentials (−60, −70, and −80 mV).
f, Example injections of CTB555 targeted to the ventrolateral periaqueductal gray (vlPAG). Scale bar: 200 μm.
g, Schematic illustrating the experimental design used to assess connectivity between ITCdm or ITCvm neurons and CeM neurons projecting to the vlPAG. vlPAG-projecting CeM neurons were retrogradely labelled with CTB injections into the vlPAG. Whole-cell recordings were performed in CTB+ CeM neurons while photostimulating incoming axons expressing ChR2-EYFP from either the ITCdm or ITCvm.
h, Summary of connectivity from ITCdm and ITCvm to vlPAG-projecting CeM neurons (n = 15 neurons from 4 mice and n = 10 neurons from 4 mice). * P = 0.0001, Fisher’s exact test.
i, Evoked IPSC amplitudes recorded from CTB+ CeM neurons (at 0 mV holding potential) in response to stimulation of axons from ITCdm or ITCvm.
j, Example injections of CTB555 and CTB647 targeted to the PL or IL, respectively. Scale bar: 500 μm.
k, Example BLA histology showing PL- (PLp) and IL-projecting (ILp) BLA neurons. Both subpopulations are located in the medial part of the BLA. Scale bar: 200 μm.
l, Mostly non-overlapping PLp and ILp subpopulations; orange arrow indicates an example of a double-labelled neuron. Scale bar: 50 μm.
m, Quantification of double-labelled neurons (N = 3 mice). Error bars: mean ± SEM
n, State-dependent functional changes in amygdala circuitry regulated by ITC clusters. Node size indicates activity levels, connection width represents putative functional connection strength.
Supplementary Material
Acknowledgements
We thank F. Ferraguti (Univ. Innsbruck) for valuable discussions on ITC cluster nomenclature; J. Felsenberg (FMI), P. Tovote (Univ. Würzburg), and A. Uematsu (RikenCBS / Univ. Tokyo) for reading and commenting on earlier versions of the manuscript; T. Mrsic-Flogel (UCL), M. Häusser (UCL) and B. Roska (FMI, IOB) for discussion and serving as thesis committee members for K.M.H.; E. Susaki (Univ. Tokyo) for sharing the CUBIC protocol; Y. Tanaka (Univ. Tokyo / Harvard) for sharing the NMDG-based slice preparation protocol; L. Choo (Univ. Basel) for slice physiology demonstration; the GENIE Project (HHMI Janelia) for making GCaMP6f, jGCaMP7f, jRGECO1a materials available; Bryan Roth (UNC) for making KORD, DREADD materials available; Karl Deisseroth (Stanford) for making the ChR2 material available; Edward Boyden (MIT) for making the soCoChR material available; All the Lüthi, Holmes, and Ehrlich lab members for discussion and support, especially T. Eichlisberger for excellent animal care; FMI animal facility, microscopy core facility (FAIM), especially L. Gelman and J. Eglinger, and IT department for constant support. This work was supported by the European Research Council (ERC) under the European Union’s Horizon 2020 research and innovation program (grant agreement no. 669582), and a Swiss National Science Foundation core grant (310030B_170268) (all to A.Lüthi); by the NIAAA Intramural Research Program (to A.H.); by the German Research Foundation DFG EH 197/3-1 (to I.E.); and by the Novartis Research Foundation.
Footnotes
Competing interests
The authors declare no competing interests.
References
- 1.Craske MG et al. Anxiety disorders. Nat Rev Dis Primers 3, 17024, doi: 10.1038/nrdp.2017.24 (2017). [DOI] [PMC free article] [PubMed] [Google Scholar]
- 2.Duvarci S & Pare D Amygdala microcircuits controlling learned fear. Neuron 82, 966–980, doi: 10.1016/j.neuron.2014.04.042 (2014). [DOI] [PMC free article] [PubMed] [Google Scholar]
- 3.Milad MR & Quirk GJ Fear extinction as a model for translational neuroscience: ten years of progress. Annual review of psychology 63, 129–151, doi: 10.1146/annurev.psych.121208.131631 (2012). [DOI] [PMC free article] [PubMed] [Google Scholar]
- 4.Orsini CA & Maren S Neural and cellular mechanisms of fear and extinction memory formation. Neurosci Biobehav Rev 36, 1773–1802, doi: 10.1016/j.neubiorev.2011.12.014 (2012). [DOI] [PMC free article] [PubMed] [Google Scholar]
- 5.Tovote P, Fadok JP & Luthi A Neuronal circuits for fear and anxiety. Nature reviews. Neuroscience 16, 317–331, doi: 10.1038/nrn3945 (2015). [DOI] [PubMed] [Google Scholar]
- 6.Li B Central amygdala cells for learning and expressing aversive emotional memories. Curr Opin Behav Sci 26, 40–45, doi: 10.1016/j.cobeha.2018.09.012 (2019). [DOI] [PMC free article] [PubMed] [Google Scholar]
- 7.LeDoux JE Emotion circuits in the brain. Annual review of neuroscience 23, 155–184, doi:DOI 10.1146/annurev.neuro.23.1.155 (2000). [DOI] [PubMed] [Google Scholar]
- 8.Bouton ME Context, ambiguity, and unlearning: sources of relapse after behavioral extinction. Biol Psychiatry 52, 976–986, doi: 10.1016/s0006-3223(02)01546-9 (2002). [DOI] [PubMed] [Google Scholar]
- 9.Herry C et al. Neuronal circuits of fear extinction. Eur J Neurosci 31, 599–612, doi: 10.1111/j.1460-9568.2010.07101.x (2010). [DOI] [PubMed] [Google Scholar]
- 10.Busti D et al. Different fear states engage distinct networks within the intercalated cell clusters of the amygdala. The Journal of neuroscience : the official journal of the Society for Neuroscience 31, 5131–5144, doi: 10.1523/JNEUROSCI.6100-10.2011 (2011). [DOI] [PMC free article] [PubMed] [Google Scholar]
- 11.Collins DR & Pare D Spontaneous and evoked activity of intercalated amygdala neurons. Eur J Neurosci 11, 3441–3448, doi: 10.1046/j.1460-9568.1999.00763.x (1999). [DOI] [PubMed] [Google Scholar]
- 12.Millhouse OE The intercalated cells of the amygdala. J Comp Neurol 247, 246–271, doi: 10.1002/cne.902470209 (1986). [DOI] [PubMed] [Google Scholar]
- 13.Waclaw RR, Ehrman LA, Pierani A & Campbell K Developmental origin of the neuronal subtypes that comprise the amygdalar fear circuit in the mouse. The Journal of neuroscience : the official journal of the Society for Neuroscience 30, 6944–6953, doi: 10.1523/JNEUROSCI.5772-09.2010 (2010). [DOI] [PMC free article] [PubMed] [Google Scholar]
- 14.Royer S, Martina M & Pare D An inhibitory interface gates impulse traffic between the input and output stations of the amygdala. The Journal of neuroscience : the official journal of the Society for Neuroscience 19, 10575–10583 (1999). [DOI] [PMC free article] [PubMed] [Google Scholar]
- 15.Amano T, Unal CT & Pare D Synaptic correlates of fear extinction in the amygdala. Nature neuroscience 13, 489–494, doi: 10.1038/nn.2499 (2010). [DOI] [PMC free article] [PubMed] [Google Scholar]
- 16.Likhtik E, Popa D, Apergis-Schoute J, Fidacaro GA & Pare D Amygdala intercalated neurons are required for expression of fear extinction. Nature 454, 642–645, doi: 10.1038/nature07167 (2008). [DOI] [PMC free article] [PubMed] [Google Scholar]
- 17.Asede D, Bosch D, Luthi A, Ferraguti F & Ehrlich I Sensory inputs to intercalated cells provide fear-learning modulated inhibition to the basolateral amygdala. Neuron 86, 541–554, doi: 10.1016/j.neuron.2015.03.008 (2015). [DOI] [PubMed] [Google Scholar]
- 18.Manko M, Geracitano R & Capogna M Functional connectivity of the main intercalated nucleus of the mouse amygdala. J Physiol 589, 1911–1925, doi: 10.1113/jphysiol.2010.201475 (2011). [DOI] [PMC free article] [PubMed] [Google Scholar]
- 19.Grewe BF et al. Neural ensemble dynamics underlying a long-term associative memory. Nature 543, 670–675, doi: 10.1038/nature21682 (2017). [DOI] [PMC free article] [PubMed] [Google Scholar]
- 20.Luo R et al. A dopaminergic switch for fear to safety transitions. Nat Commun 9, 2483, doi: 10.1038/s41467-018-04784-7 (2018). [DOI] [PMC free article] [PubMed] [Google Scholar]
- 21.Salinas-Hernandez XI et al. Dopamine neurons drive fear extinction learning by signaling the omission of expected aversive outcomes. Elife 7, doi: 10.7554/eLife.38818 (2018). [DOI] [PMC free article] [PubMed] [Google Scholar]
- 22.Strobel C, Marek R, Gooch HM, Sullivan RKP & Sah P Prefrontal and Auditory Input to Intercalated Neurons of the Amygdala. Cell Rep 10, 1435–1442, doi: 10.1016/j.celrep.2015.02.008 (2015). [DOI] [PubMed] [Google Scholar]
- 23.Herry C et al. Switching on and off fear by distinct neuronal circuits. Nature 454, 600–606, doi: 10.1038/nature07166 (2008). [DOI] [PubMed] [Google Scholar]
- 24.Pare D & Smith Y GABAergic projection from the intercalated cell masses of the amygdala to the basal forebrain in cats. J Comp Neurol 344, 33–49, doi: 10.1002/cne.903440104 (1994). [DOI] [PubMed] [Google Scholar]
- 25.Tovote P et al. Midbrain circuits for defensive behaviour. Nature 534, 206–212, doi: 10.1038/nature17996 (2016). [DOI] [PubMed] [Google Scholar]
- 26.Senn V et al. Long-range connectivity defines behavioral specificity of amygdala neurons. Neuron 81, 428–437, doi: 10.1016/j.neuron.2013.11.006 (2014). [DOI] [PubMed] [Google Scholar]
- 27.McGarry LM & Carter AG Inhibitory Gating of Basolateral Amygdala Inputs to the Prefrontal Cortex. J Neurosci 36, 9391–9406, doi: 10.1523/JNEUROSCI.0874-16.2016 (2016). [DOI] [PMC free article] [PubMed] [Google Scholar]
- 28.Arruda-Carvalho M & Clem RL Prefrontal-amygdala fear networks come into focus. Front Syst Neurosci 9, 145, doi: 10.3389/fnsys.2015.00145 (2015). [DOI] [PMC free article] [PubMed] [Google Scholar]
- 29.Koyama M & Pujala A Mutual inhibition of lateral inhibition: a network motif for an elementary computation in the brain. Curr Opin Neurobiol 49, 69–74, doi: 10.1016/j.conb.2017.12.019 (2018). [DOI] [PubMed] [Google Scholar]
- 30.Machens CK, Romo R & Brody CD Flexible control of mutual inhibition: a neural model of two-interval discrimination. Science 307, 1121–1124, doi: 10.1126/science.1104171 (2005). [DOI] [PubMed] [Google Scholar]
- 31.Felsenberg J et al. Integration of Parallel Opposing Memories Underlies Memory Extinction. Cell 175, 709–722 e715, doi: 10.1016/j.cell.2018.08.021 (2018). [DOI] [PMC free article] [PubMed] [Google Scholar]
- 32.Solomon RL & Corbit JD Opponent-Process Theory of Motivation.1. Temporal Dynamics of Affect. Psychological Review 81, 119–145, doi:DOI 10.1037/h0036128 (1974). [DOI] [PubMed] [Google Scholar]
- 33.Zhang X, Kim J & Tonegawa S Amygdala Reward Neurons Form and Store Fear Extinction Memory. Neuron 105, 1077–1093 e1077, doi: 10.1016/j.neuron.2019.12.025 (2020). [DOI] [PubMed] [Google Scholar]
- 34.Braak H & Braak E Neuronal types in the basolateral amygdaloid nuclei of man. Brain Res Bull 11, 349–365, doi: 10.1016/0361-9230(83)90171-5 (1983). [DOI] [PubMed] [Google Scholar]
Methods References
- 35.Rousso DL et al. Two Pairs of ON and OFF Retinal Ganglion Cells Are Defined by Intersectional Patterns of Transcription Factor Expression. Cell Rep 15, 1930–1944, doi: 10.1016/j.celrep.2016.04.069 (2016). [DOI] [PMC free article] [PubMed] [Google Scholar]
- 36.Guenthner CJ, Miyamichi K, Yang HH, Heller HC & Luo L Permanent genetic access to transiently active neurons via TRAP: targeted recombination in active populations. Neuron 78, 773–784, doi: 10.1016/j.neuron.2013.03.025 (2013). [DOI] [PMC free article] [PubMed] [Google Scholar]
- 37.Chen TW et al. Ultrasensitive fluorescent proteins for imaging neuronal activity. Nature 499, 295–300, doi: 10.1038/nature12354 (2013). [DOI] [PMC free article] [PubMed] [Google Scholar]
- 38.Vardy E et al. A New DREADD Facilitates the Multiplexed Chemogenetic Interrogation of Behavior. Neuron 86, 936–946, doi: 10.1016/j.neuron.2015.03.065 (2015). [DOI] [PMC free article] [PubMed] [Google Scholar]
- 39.Armbruster BN, Li X, Pausch MH, Herlitze S & Roth BL Evolving the lock to fit the key to create a family of G protein-coupled receptors potently activated by an inert ligand. Proceedings of the National Academy of Sciences of the United States of America 104, 5163–5168, doi: 10.1073/pnas.0700293104 (2007). [DOI] [PMC free article] [PubMed] [Google Scholar]
- 40.Shemesh OA et al. Temporally precise single-cell-resolution optogenetics. Nature neuroscience 20, 1796–1806, doi: 10.1038/s41593-017-0018-8 (2017). [DOI] [PMC free article] [PubMed] [Google Scholar]
- 41.Dana H et al. Sensitive red protein calcium indicators for imaging neural activity. Elife 5, doi: 10.7554/eLife.12727 (2016). [DOI] [PMC free article] [PubMed] [Google Scholar]
- 42.Dana H et al. High-performance calcium sensors for imaging activity in neuronal populations and microcompartments. Nature methods 16, 649–657, doi: 10.1038/s41592-019-0435-6 (2019). [DOI] [PubMed] [Google Scholar]
- 43.Renier N et al. iDISCO: a simple, rapid method to immunolabel large tissue samples for volume imaging. Cell 159, 896–910, doi: 10.1016/j.cell.2014.10.010 (2014). [DOI] [PubMed] [Google Scholar]
- 44.Susaki EA et al. Whole-brain imaging with single-cell resolution using chemical cocktails and computational analysis. Cell 157, 726–739, doi: 10.1016/j.cell.2014.03.042 (2014). [DOI] [PubMed] [Google Scholar]
- 45.Federico Claudi ALT, Tiago Branco. Brainrender. A python based software for visualisation of neuroanatomical and morphological data. bioRxiv, doi:doi: 10.1101/2020.02.23.961748 (2020). [DOI] [Google Scholar]
- 46.Ghosh KK et al. Miniaturized integration of a fluorescence microscope. Nature methods 8, 871–878, doi: 10.1038/nmeth.1694 (2011). [DOI] [PMC free article] [PubMed] [Google Scholar]
- 47.Franklin KBJ & Paxinos G The mouse brain in stereotaxic coordinates. (Academic Press, 1997). [Google Scholar]
- 48.Bukalo O et al. Prefrontal inputs to the amygdala instruct fear extinction memory formation. Sci Adv 1, doi: 10.1126/sciadv.1500251 (2015). [DOI] [PMC free article] [PubMed] [Google Scholar]
- 49.Petreanu L, Huber D, Sobczyk A & Svoboda K Channelrhodopsin-2-assisted circuit mapping of long-range callosal projections. Nature neuroscience 10, 663–668, doi: 10.1038/nn1891 (2007). [DOI] [PubMed] [Google Scholar]
- 50.Tanaka Y, Tanaka Y, Furuta T, Yanagawa Y & Kaneko T The effects of cutting solutions on the viability of GABAergic interneurons in cerebral cortical slices of adult mice. J Neurosci Methods 171, 118–125, doi: 10.1016/j.jneumeth.2008.02.021 (2008). [DOI] [PubMed] [Google Scholar]
- 51.Ting JT, Daigle TL, Chen Q & Feng G Acute brain slice methods for adult and aging animals: application of targeted patch clamp analysis and optogenetics. Methods Mol Biol 1183, 221–242, doi: 10.1007/978-1-4939-1096-0_14 (2014). [DOI] [PMC free article] [PubMed] [Google Scholar]
- 52.Lerner TN et al. Intact-Brain Analyses Reveal Distinct Information Carried by SNc Dopamine Subcircuits. Cell 162, 635–647, doi: 10.1016/j.cell.2015.07.014 (2015). [DOI] [PMC free article] [PubMed] [Google Scholar]
- 53.Gunaydin LA et al. Natural neural projection dynamics underlying social behavior. Cell 157, 1535–1551, doi: 10.1016/j.cell.2014.05.017 (2014). [DOI] [PMC free article] [PubMed] [Google Scholar]
- 54.Lopes G et al. Bonsai: an event-based framework for processing and controlling data streams. Front Neuroinform 9, 7, doi: 10.3389/fninf.2015.00007 (2015). [DOI] [PMC free article] [PubMed] [Google Scholar]
- 55.An B et al. Amount of fear extinction changes its underlying mechanisms. Elife 6, doi: 10.7554/eLife.25224 (2017). [DOI] [PMC free article] [PubMed] [Google Scholar]
- 56.Baek J et al. Neural circuits underlying a psychotherapeutic regimen for fear disorders. Nature 566, 339–343, doi: 10.1038/s41586-019-0931-y (2019). [DOI] [PubMed] [Google Scholar]
- 57.Pnevmatikakis EA & Giovannucci A NoRMCorre: An online algorithm for piecewise rigid motion correction of calcium imaging data. J Neurosci Methods 291, 83–94, doi: 10.1016/j.jneumeth.2017.07.031 (2017). [DOI] [PubMed] [Google Scholar]
- 58.Hagihara KM, Murakami T, Yoshida T, Tagawa Y & Ohki K Neuronal activity is not required for the initial formation and maturation of visual selectivity. Nature neuroscience 18, 1780–1788, doi: 10.1038/nn.4155 (2015). [DOI] [PubMed] [Google Scholar]
- 59.Kerlin AM, Andermann ML, Berezovskii VK & Reid RC Broadly tuned response properties of diverse inhibitory neuron subtypes in mouse visual cortex. Neuron 67, 858–871, doi: 10.1016/j.neuron.2010.08.002 (2010). [DOI] [PMC free article] [PubMed] [Google Scholar]
- 60.Grundemann J et al. Amygdala ensembles encode behavioral states. Science 364, doi: 10.1126/science.aav8736 (2019). [DOI] [PubMed] [Google Scholar]
Associated Data
This section collects any data citations, data availability statements, or supplementary materials included in this article.
Supplementary Materials
Data Availability Statement
The data that support the findings of this study are available at: https://data.fmi.ch/PublicationSupplementRepo/


