
Extended Data Fig. 7 |. Ex vivo validation of KORD.
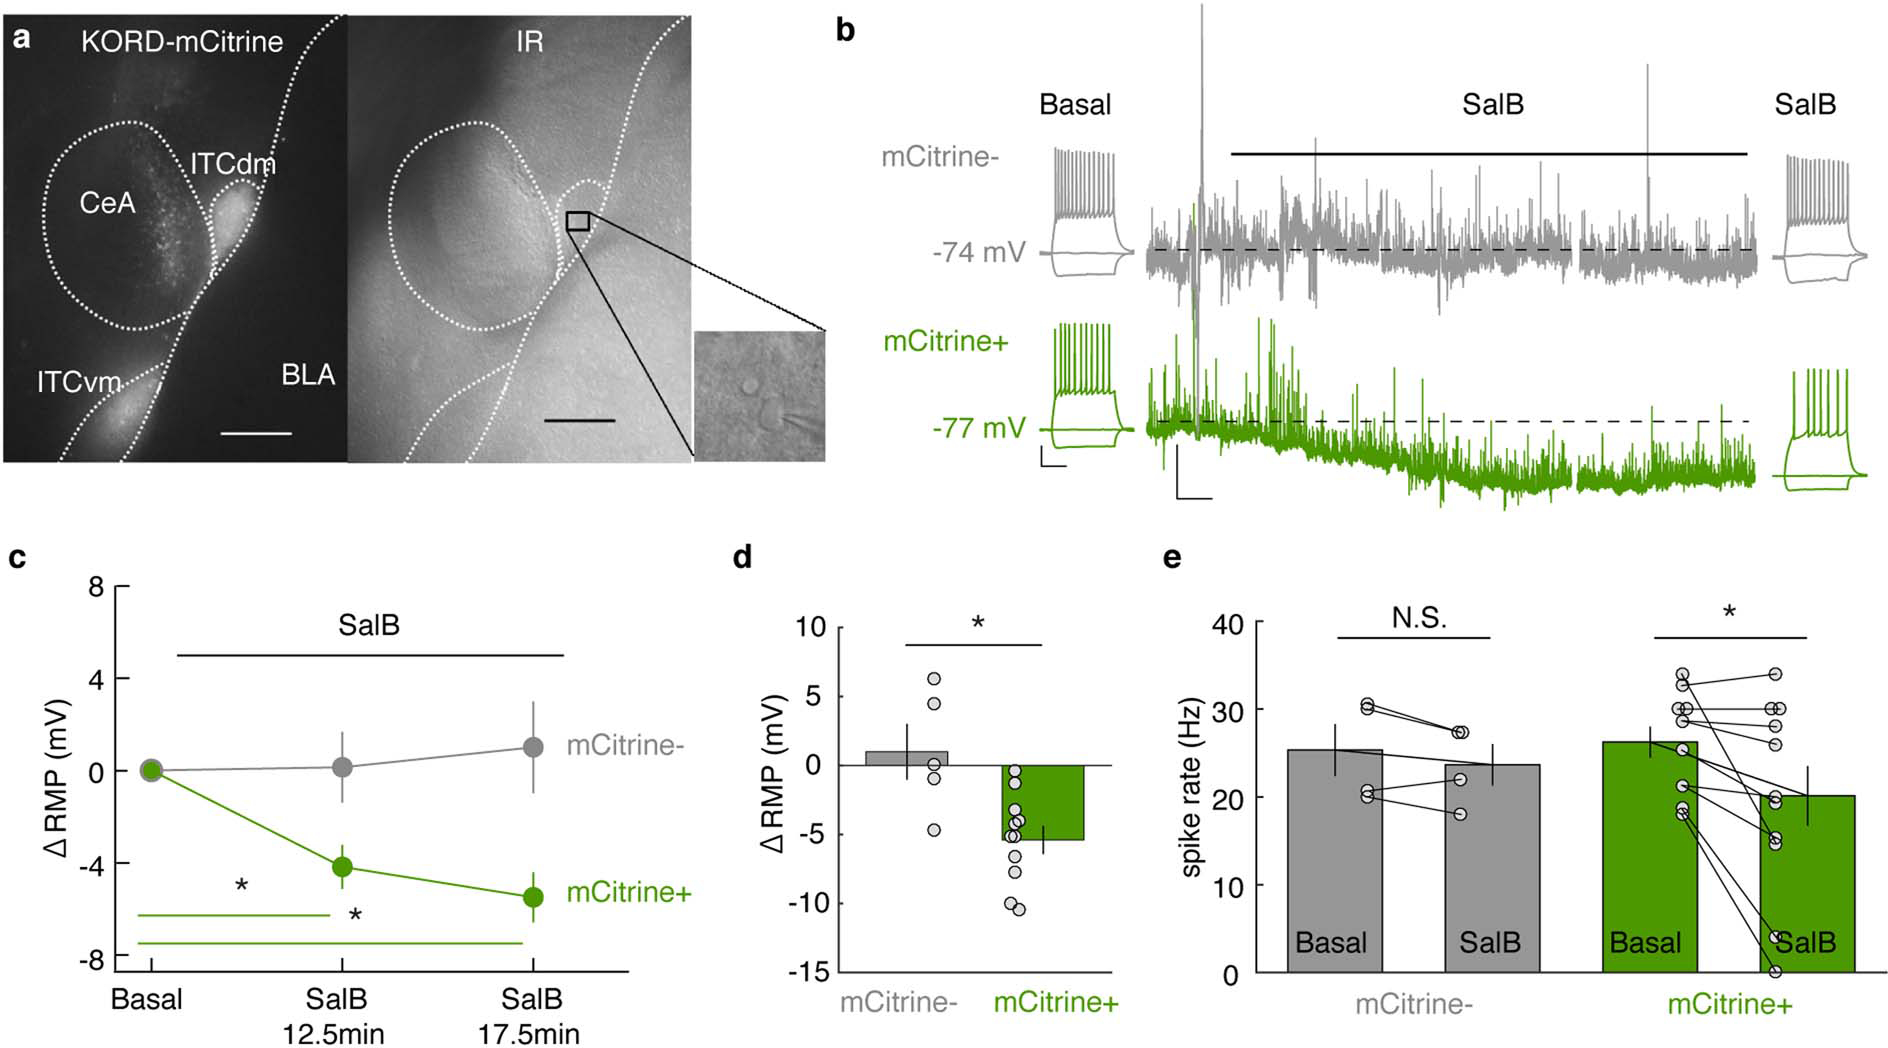
a, Fluorescence (mCitrine, left) and infrared (IR, right) images from a slice used for recordings in a FoxP2-Cre mouse injected with an AAV-DIO-KORD-mCitrine into ITCdm and ITCvm. Inset: Infrared image from a recorded ITCdm neuron. Scale bar: 200 μm.
b, Representative current-clamp traces illustrating supra-threshold responses to a +60 pA current injection and continuous recording of the resting membrane potential (RMP) during application of Salvinorin B (SalB, 100 nM) from control (mCitrine−) and KORD-infected (mCitrine+) ITC neurons. Scale bars: RMP: 5 mV, 1 min; current steps: 20 mV, 200 ms.
c, SalB application induced a significant hyperpolarization of the membrane potential in mCitrine+ neurons (n = 10 neurons from 4 mice) at both time points vs. baseline (12.5-min: * P = 0.003, 17.5-min: * P = 0.0001, Two-sided Dunnett’s test). Changes in membrane potential were not significant in the mCitrine− control neurons (n = 5 neurons from 3 mice) at both time points vs. baseline (12.5-min: P = 0.99, 17.5-min: P = 0.84, Dunnett’s test). Error bars: mean ± SEM
d, Comparison of membrane potential changes (ΔRMP) at 17.5 min after application of SalB. Changes in KORD-infected neurons (mCitrine+) were significantly different from control (* P = 0.013, Wilcoxon rank-sum test; n = 5 neurons from 3 mice and n =11 neurons from 5 mice for mCitrine− and mCitrine+, respectively). Error bars: mean ± SEM
e, Comparisons of spike rates in response to +60 pA current injections before and 17.5 min after application of SalB. KORD-infected neurons (mCitrine+, n = 11) significantly reduced spike rate (from 26.2 ± 1.69 Hz to 20.1 ± 3.30 Hz, * P = 0.016, Wilcoxon signed-rank test). In contrast, mCitrine- neurons (n = 4 neurons from 3 mice) did not show a significant reduction in spike rate (from 25.3 ± 2.89 Hz to 23.7 ± 2.27 Hz, P = 0.25, Wilcoxon signed-rank test). Error bars: mean ± SEM