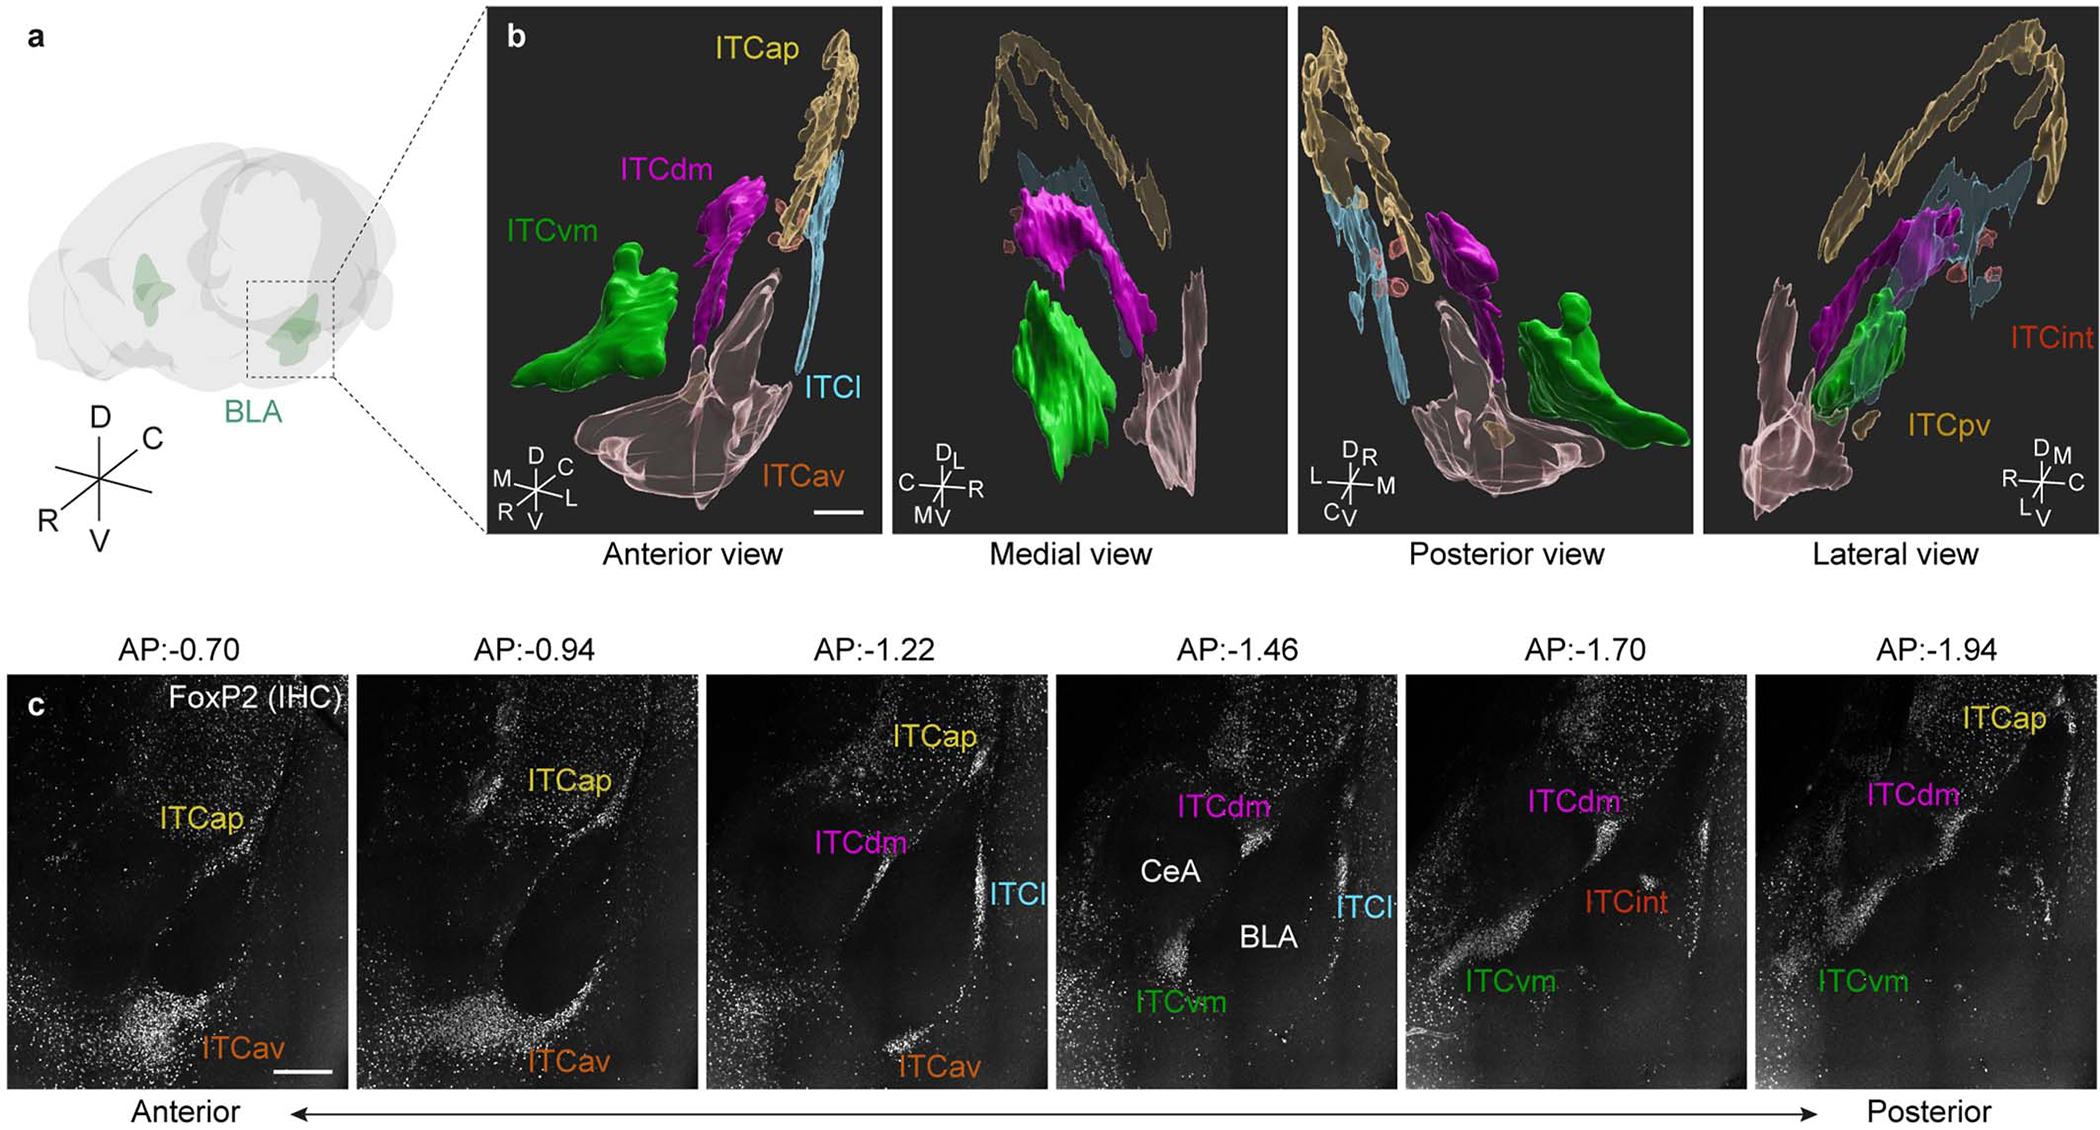
Extended Data Fig. 1 |. 3D-reconstruction of individual ITC clusters.

a, Schematic of a mouse brain volume. R: Rostral; C: Caudal; D: Dorsal; V: Ventral.
b, 3D reconstructions were separately obtained via 1) anti-FoxP2 immunostaining, 2) a FoxP2-Cre x Ai14 mouse, and 3) D1R-Cre x Ai14 mouse, in triplicate for each method. ITCap: apical; ITCdm: dorsomedial; ITCvm: ventromedial; ITCl: lateral; ITCav: anteroventral; ITCint: internal; ITCpv: posteroventral R: Rostral; C: Caudal; D: Dorsal; V: Ventral; M: Medial; L: Lateral; Scale bar: 300 μm.
c, Example planes of a cleared 3D-tissue obtained from a WT mouse stained with an anti-FoxP2 antibody covering the anterior-posterior axis of ITC clusters. Bregma levels are indicated above each panel. Scale bar: 300 μm.
See also Supplementary Movie 1 and Table 1.
