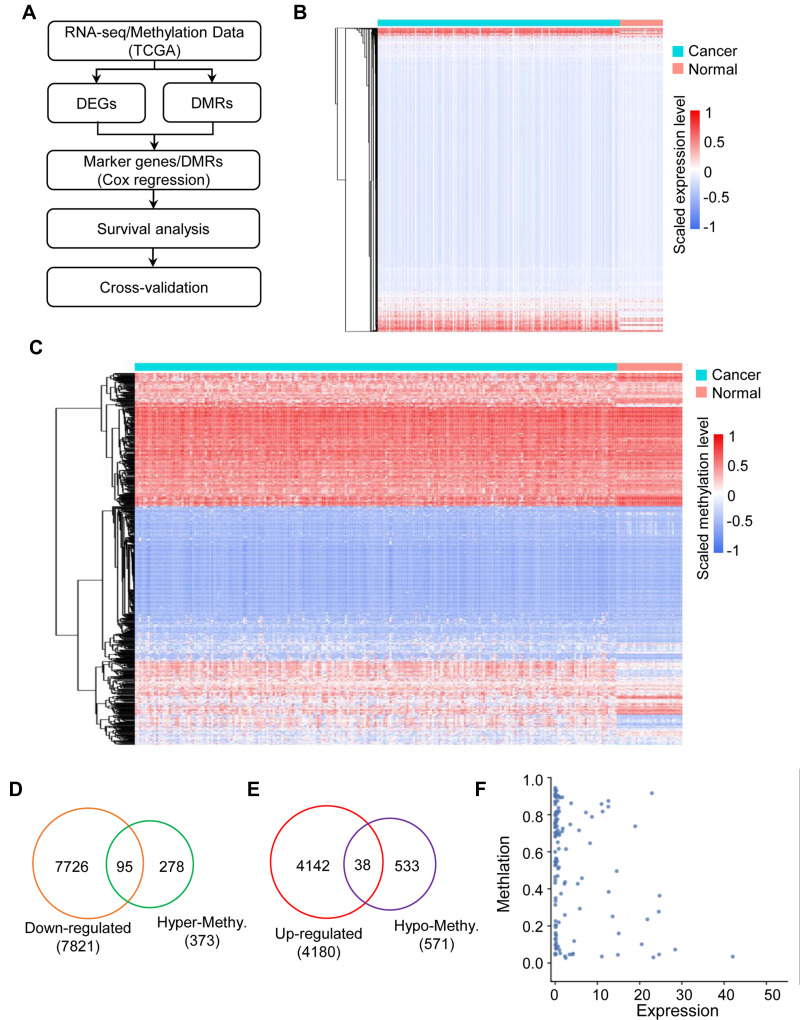
Figure 1.
The landscape of gene expression and methylation in colon cancer. (A) Flowchart of the data analysis pipeline in this study. (B) Heatmap showing the differentially expressed genes in the colon cancer and normal groups. (C) Heatmap showing the differentially methylated regions associated with genes in the colon cancer and normal groups. (D) Venn diagram showing the down-regulated genes associated with hypermethylated sites in colon cancer. (E) Venn diagram showing the up-regulated genes associated with hypomethylated sites in colon cancer. (F) Scatter plot showing the correlation between differentially expressed genes and differentially methylated regions in colon cancer.

