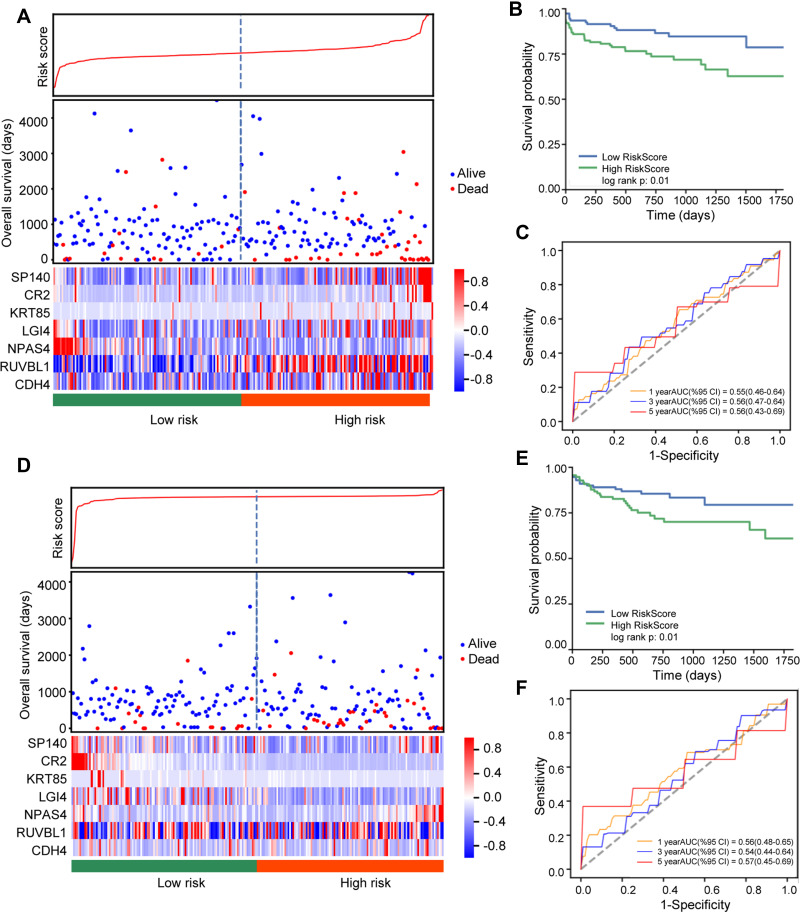
Figure 4.
Risk analysis of the selected genes in colon cancer. (A) Distribution of risk score, survival status and expression level in the training dataset. (B) Kaplan–Meier survival curve for risk score in the training dataset. (C) Time-dependent ROC analysis of 1-year (orange), 3-year (blue) and 5-year (red) overall survival in the training dataset using the selected genes. (D) Distribution of risk score, survival status and expression level in the testing dataset. (E) Kaplan–Meier survival curve for risk score in the testing dataset. (F) Time-dependent ROC analysis of 1-year (orange), 3-year (blue) and 5-year (red) overall survival in the testing dataset using the selected genes.

