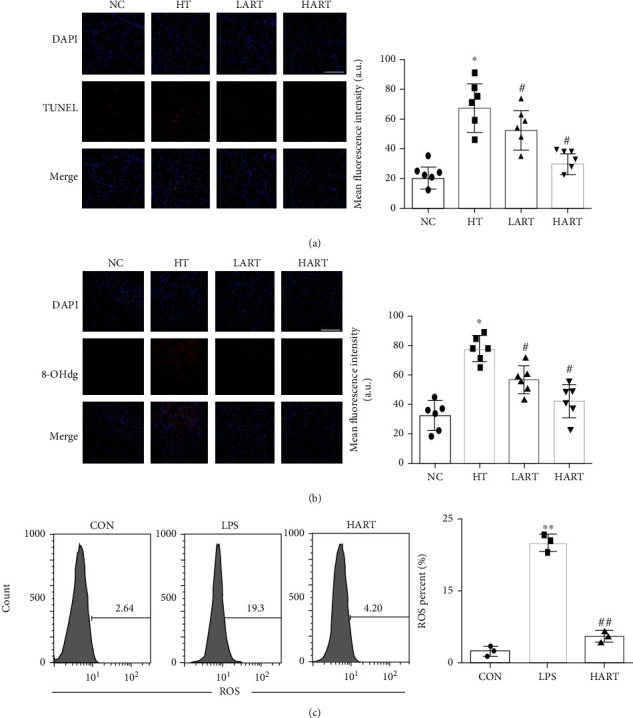
Figure 4.

(a) TUNEL staining and mean fluorescence intensity of the heart (blue: DAPI, red: TUNEL); (b) 8-OHdg staining mean fluorescence intensity of the heart (blue: DAPI, red: 8-OHdg; ∗P < 0.05 compared with NC; #P < 0.05 compared with HT); (c) ROS of DCs after stimulation with LPS (∗∗P < 0.01 compared with CON; ##P < 0.01 compared with LPS).
